Castle (Colchester electoral ward)
| Castle | |
|---|---|
| Electoral ward for Colchester Borough Council | |
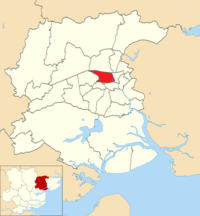 Castle ward (in red) displayed within Colchester Borough | |
| Ward Information | |
| Created | Unknown |
| Councillors | 3 |
| Electorate | 7,615 (2015) |
| Created from |
Unknown St. Marys (2002) |
| Overlaps | |
| Parliament constituency |
Colchester (Unknown-1983; 1997-present) Colchester North (1983-1997) |
| County division | Abbey |
| European Parliament constituency | East of England |
Castle ward is an electoral ward in Colchester and is within the Colchester Borough Council boundary, to which it elects 3 councillors.
The ward covers central Colchester, including the Town Centre, the historic Dutch Quarter neighbourhood and Colchester Castle, which lends its namesake to the ward.
History
Castle ward has existed since at least 1976 and is still in use today. The boundaries of the ward have seldom changed, with the exception of the amalgamation of the St. Marys neighbourhood (from St. Marys ward) into the west of Castle following boundary changes from the 2002 election.
The ward was originally held by the Labour Party and then changed hands between the Conservatives, Labour and the SDP-Liberal Alliance (later Liberal Democrats) until the 1990 election, when the Liberal Democrats solidly held the ward for the next 25 years. Recently, it has become a marginal ward, last won by the Conservatives at the 2015 election.
Castle has the highest vote share for the Green Party in a Colchester ward.
Ward Councillors
Current
| Name | Party | Years in Office | |||
|---|---|---|---|---|---|
| Nick Barlow | Liberal Democrats | 2007–2015; 2016-present | |||
| Darius Laws | Conservative | 2015-present | |||
| Daniel Ellis | Conservative | 2016-present | |||
Former
| Name | Party | Years in Office | |||
|---|---|---|---|---|---|
| Kenneth Cooke | Labour | 1978-1992; 1995-1999 | |||
| D. Dunn | Labour | 1979-1983 | |||
| D. Goodchild | Labour | 1980-1984 | |||
| E. Humphrey | Conservative | 1983-1987 | |||
| R. Cole | Conservative | 1984-1988 | |||
| as above | Liberal Democrats | 1988-1990 | |||
| Chris Hall | Liberal Democrats | 1987-2010 | |||
| J. Carter | Liberal Democrats | 1990-1995 | |||
| William Spyvee | Liberal Democrats | 1990-2012 | |||
| Kenneth Jones | Liberal Democrats | 1999-2007 | |||
| Bill Frame | Liberal Democrats | 2010-2016 | |||
| Jo Hayes | Liberal Democrats | 2012-2016 | |||
Elections
Election Results
| Election | Political result | Candidate | Party | Votes | % | ±% | ||
|---|---|---|---|---|---|---|---|---|
| 2015 election Electorate: 7,615 Turnout: 4,642 (61.0%) +23.0 | Conservative gain from Liberal Democrat Majority: 496 (10.6%) N/A Swing: 6.2% from Lib Dem to Con | Darius Laws | Conservative | 1,667 | 35.9 | +11.8 | ||
| Owen Howell | Liberal Democrat | 1,172 | 25.2 | -0.5 | ||||
| Andrew Canessa | Green | 982 | 21.2 | +4.0 | ||||
| Andrew Murphy | Labour | 821 | 17.7 | -0.1 | ||||
| 2014 election Turnout: 2,683 (38.0%) +8.0 | Liberal Democrat hold Majority: 46 (1.7%) -20.2 Swing: 10.4% from Lib Dem to Con | Bill Frame | Liberal Democrat | 693 | 25.8 | -14.6 | ||
| Darius Laws | Conservative | 647 | 24.1 | +6.2 | ||||
| Ben Howard | Labour | 478 | 17.8 | +4.4 | ||||
| Peter Lynn | Green | 462 | 17.2 | -1.4 | ||||
| Ron Levy | UKIP | 403 | 15.0 | +5.3 | ||||
| 2012 election Turnout: 2,129 (30.0%) -9.5 | Liberal Democrat hold Majority: 466 (21.9%) +7.6 Swing: 4.2% from Green to Lib Dem | Jo Hayes | Liberal Democrat | 861 | 40.4 | +0.3 | ||
| Peter Lynn | Green | 395 | 18.6 | -7.1 | ||||
| Mohammed Rashid | Conservative | 382 | 17.9 | -3.1 | ||||
| Robert Fisher | Labour | 285 | 13.4 | +0.2 | ||||
| Ron Levy | UKIP | 206 | 9.7 | N/A | ||||
| 2011 election Turnout: 2,779 (39.5%) -19.6 | Liberal Democrat hold Majority: 398 (14.3%) -1.3 Swing: 3.0% from Lib Dem to Green | Nick Barlow | Liberal Democrat | 1,113 | 40.1 | -1.7 | ||
| Peter Lynn | Green | 715 | 25.7 | +4.2 | ||||
| Bruce Halling | Conservative | 583 | 21.0 | -5.2 | ||||
| Luke Dopson | Labour | 368 | 13.2 | +2.6 | ||||
| 2010 election Turnout: 4,248 (59.1%) +21.0 | Liberal Democrat hold Majority: 662 (15.6%) +2.1 Swing: 6.0% from Lib Dem to Con | Bill Frame | Liberal Democrat | 1,774 | 41.8 | -3.4 | ||
| Lucy Cramer | Conservative | 1,112 | 26.2 | +8.6 | ||||
| Peter Lynn | Green | 913 | 21.5 | -10.2 | ||||
| Adam Fox | Labour | 449 | 10.6 | +5.1 | ||||
| 2008 election Turnout: 2,460 (38.1%) +0.7 | Liberal Democrat hold Majority: 332 (13.5%) +4.8 Swing: 2.2% from Green to Lib Dem | William Spyvee | Liberal Democrat | 1,111 | 45.2 | +4.2 | ||
| Peter Lynn | Green | 779 | 31.7 | -0.6 | ||||
| Darius Laws | Conservative | 434 | 17.6 | -2.9 | ||||
| John Cooke | Labour | 136 | 5.5 | -0.7 | ||||
| 2007 election Turnout: 2,291 (37.4%) +1.4 | Liberal Democrat hold Majority: 200 (8.7%) -17.3 Swing: 8.7% from Lib Dem to Green | Nick Barlow | Liberal Democrat | 940 | 41.0 | -7.7 | ||
| Peter Lynn | Green | 740 | 32.3 | +9.7 | ||||
| Glenn Granger | Conservative | 469 | 20.5 | +2.4 | ||||
| Michael Powell | Labour | 142 | 6.2 | -1.9 | ||||
| 2006 election Turnout: 2,306 (36.0%) +0.6 | Liberal Democrat hold Majority: 600 (26.0%) -4.2 Swing: 15.9% from Lib Dem to Green | Chris Hall | Liberal Democrat | 1,122 | 48.7 | -9.2 | ||
| Peter Lynn | Green | 522 | 22.6 | N/A | ||||
| Benjamin Twitchen | Conservative | 418 | 18.1 | -9.6 | ||||
| Mark Warner | Labour | 187 | 8.1 | -6.4 | ||||
| Stephen Miller | Independent | 57 | 2.5 | N/A | ||||
| 2004 election Turnout: 2,047 (35.4%) +6.8 | Liberal Democrat hold Majority: 619 (30.2%) +0.1 Swing: 0.1% from Con to Lib Dem | William Spyvee | Liberal Democrat | 1,185 | 57.9 | +3.5 | ||
| Pauline Lucas | Conservative | 566 | 27.7 | +3.4 | ||||
| Malcolm Cannon | Labour | 296 | 14.5 | +1.8 | ||||
| 2003 election Turnout: 1,660 (28.6%) -3.4 | Liberal Democrat hold Majority: 499 (30.1%) Swing: 1.3% from Lib Dem to Con | Kenneth Jones | Liberal Democrat | 903 | 54.4 | -2.0 | ||
| Pauline Lucas | Conservative | 404 | 24.3 | +4.8 | ||||
| Malcolm Cannon | Labour | 210 | 12.7 | -1.4 | ||||
| Walter Schwarz | Green | 132 | 8.0 | -2.0 | ||||
| 2000 election Turnout: 31.0% (-1.0) | Liberal Democrat hold Majority: 263 (14.3%) -4.4 Swing: 3.8% from Lab to Lib Dem | William Spyvee | Liberal Democrat | 788 | 42.9 | -1.4 | ||
| N. Stock | Conservative | 525 | 28.6 | +8.6 | ||||
| Kim Naish | Labour | 486 | 26.4 | -10.8 | ||||
| L. Basker | Natural Law | 39 | 2.1 | N/A | ||||
| 1999 election Turnout: 32.2% | Liberal Democrat hold Majority: 8.9% Swing: 3.5% from Lib Dem to Lab | Kenneth Jones | Liberal Democrat | 834 | 44.3 | |||
| J. Thomas | Labour | 666 | 35.4 | |||||
| M. Coyne | Conservative | 384 | 20.4 | |||||
| 1998 election Turnout: 34.0% | Liberal Democrat hold Majority: 15.8% Swing: 4.6% from Lab to Lib Dem | Chris Hall | Liberal Democrat | 907 | 44.5 | |||
| Chris Pearson | Labour | 585 | 28.7 | |||||
| N. Stock | Conservative | 514 | 25.2 | |||||
| L. Basker | Natural Law | 32 | 1.6 | |||||
| 1996 election | Liberal Democrat hold Majority: 7.7% Swing: 4.2% from Lab to Lib Dem | William Spyvee | Liberal Democrat | unopposed | ||||
Charts
Vote Share: 1976-2000

Vote Share: 2000-2015

Polling districts
Electorate in brackets (as of 2015):[1]
- AF: Castle (1,500)
- AE: Jumbo (1,201)
- AG: Riverside (2,247)
- AH: Cowdray Avenue (2,488)
References
- ↑ "Colchester Borough Council Draft Polling District and Polling Place Review 2015". Colchester Borough Council. Retrieved 25 January 2016.