Caerphilly (UK Parliament constituency)
Not to be confused with Caerphilly (Assembly constituency).
Coordinates: 51°34′44″N 3°13′05″W / 51.579°N 3.218°W
| Caerphilly | |
|---|---|
|
County constituency for the House of Commons | |
|
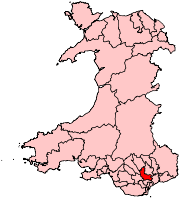
Boundary of Caerphilly in Wales. | |
| Preserved county | Gwent |
| Electorate | 61,876 (December 2010)[1] |
| Major settlements | Caerphilly, Ystrad Mynach, Bargoed, Hengoed |
| Current constituency | |
| Created | 1918 |
| Member of parliament | Wayne David (Labour) |
| Number of members | One |
| Created from | Mid Glamorganshire |
| Overlaps | |
| Welsh Assembly | South Wales East |
| European Parliament constituency | Wales |
Caerphilly (Welsh: Caerffili) is a county constituency centred on the town of Caerphilly in South Wales. It returns one Member of Parliament (MP) to the House of Commons of the Parliament of the United Kingdom, elected by the first past the post voting system.
The constituency has always elected Labour MPs.
Boundaries
The Caerphilly constituency covers roughly the southern and eastern half of Caerphilly district, the part of the district historically located in Glamorgan. In the north-west of the constituency are communities such as Hengoed and Ystrad Mynach, travelling in a southeasterly direction through Caerphilly and Llanbradach to the rural outcrops bordering Cardiff.
Members of Parliament
| Election | Member[2] | Party | |
|---|---|---|---|
| 1918 | Alfred Onions | Labour | |
| 1921 | Morgan Jones | Labour | |
| 1939 | Ness Edwards | Labour | |
| 1968 | Alfred Thomas Evans | Labour | |
| 1979 | Ednyfed Hudson Davies | Labour | |
| 1981 | SDP | ||
| 1983 | Ron Davies | Labour | |
| 2001 | Wayne David | Labour | |
Elections
Elections in the 2010s
| Party | Candidate | Votes | % | ± | |
|---|---|---|---|---|---|
| Labour | Wayne David [5] | 17,864 | 44.3 | −0.6 | |
| UKIP | Sam Gould [6] | 7,791 | 19.3 | +16.9 | |
| Conservative | Leo Docherty [7] | 6,683 | 16.6 | -0.5 | |
| Plaid Cymru | Beci Newton [8] | 5,895 | 14.6 | -2.1 | |
| Green | Katy Beddoe[9] | 937 | 2.3 | N/A | |
| Liberal Democrat | Aladdin Ayesh[10] | 935 | 2.3 | -12.4 | |
| TUSC | Jaime Davies | 178 | 0.4 | N/A | |
| Majority | 10,073 | 25.0 | -2.8 | ||
| Turnout | 40,283 | 63.3 | +1.0 | ||
| Labour hold | Swing | -8.7 | |||
| Party | Candidate | Votes | % | ± | |
|---|---|---|---|---|---|
| Labour | Wayne David | 17,377 | 44.9 | −10.5 | |
| Conservative | Maria Caulfield | 6,622 | 17.1 | +2.4 | |
| Plaid Cymru | Lindsay Whittle | 6,460 | 16.7 | −1.4 | |
| Liberal Democrat | Kay David | 5,688 | 14.7 | +4.7 | |
| BNP | Laurence Reid | 1,635 | 4.2 | N/A | |
| UKIP | Tony Jenkins | 910 | 2.4 | +2.4 | |
| Majority | 10,755 | 27.8 | -11.4 | ||
| Turnout | 38,692 | 62.3 | +5.8 | ||
| Labour hold | Swing | −6.5 | |||
Elections in the 2000s
| Party | Candidate | Votes | % | ± | |
|---|---|---|---|---|---|
| Labour | Wayne David | 22,190 | 56.6 | −1.6 | |
| Plaid Cymru | Lindsay Whittle | 6,831 | 17.4 | −3.6 | |
| Conservative | Stephen Watson | 5,711 | 14.6 | +3.2 | |
| Liberal Democrat | Ashgar Ali | 3,861 | 9.8 | +0.4 | |
| Forward Wales | Graeme Beard | 636 | 1.6 | +1.6 | |
| Majority | 15,359 | 39.2 | +2.0 | ||
| Turnout | 39,229 | 58.6 | +0.9 | ||
| Labour hold | Swing | +1.0 | |||
| Party | Candidate | Votes | % | ± | |
|---|---|---|---|---|---|
| Labour | Wayne David | 22,597 | 58.2 | −9.6 | |
| Plaid Cymru | Lindsay Whittle | 8,172 | 21.0 | +11.4 | |
| Conservative | David Simmonds | 4,415 | 11.4 | +0.6 | |
| Liberal Democrat | Rob Roffe | 3,649 | 9.4 | +1.2 | |
| Majority | 14,425 | 37.2 | -19.9 | ||
| Turnout | 38,833 | 57.7 | −12.4 | ||
| Labour hold | Swing | ||||
Elections in the 1990s
| Party | Candidate | Votes | % | ± | |
|---|---|---|---|---|---|
| Labour | Ron Davies | 30,697 | 67.3 | +3.6 | |
| Conservative | Rhodri Harris | 4,858 | 10.7 | −7.4 | |
| Plaid Cymru | Lindsay Whittle | 4,383 | 9.7 | +0.0 | |
| Liberal Democrat | Tony D. Ferguson | 3,724 | 8.2 | −0.3 | |
| Referendum | Mark E. Morgan | 1,337 | 3.0 | N/A | |
| ProLife Alliance | Catherine Williams | 270 | 0.6 | N/A | |
| Majority | 25,839 | 57.1 | +7.6 | ||
| Turnout | 45,269 | 70.1 | -7.1 | ||
| Labour hold | Swing | +5.5 | |||
| Party | Candidate | Votes | % | ± | |
|---|---|---|---|---|---|
| Labour | Ron Davies | 31,713 | 63.7 | +5.2 | |
| Conservative | Howard L. Philpott | 9,041 | 18.1 | −1.3 | |
| Plaid Cymru | Lindsay Whittle | 4,821 | 9.7 | +1.6 | |
| Liberal Democrat | Stan W. Wilson | 4,247 | 8.5 | −5.6 | |
| Majority | 22,672 | 45.5 | +6.5 | ||
| Turnout | 49,822 | 77.2 | +0.6 | ||
| Labour hold | Swing | +3.2 | |||
Elections in the 1980s
| Party | Candidate | Votes | % | ± | |
|---|---|---|---|---|---|
| Labour | Ron Davies | 28,698 | 58.44 | ||
| Conservative | Michael Edmund Powell | 9,531 | 19.41 | ||
| Liberal | Michael George Butlin | 6,923 | 14.10 | ||
| Plaid Cymru | Lindsay Whittle | 3,955 | 8.05 | ||
| Majority | 19,167 | 39.03 | |||
| Turnout | 76.55 | ||||
| Labour hold | Swing | ||||
| Party | Candidate | Votes | % | ± | |
|---|---|---|---|---|---|
| Labour | Ron Davies | 21,570 | 45.61 | ||
| Liberal | A Lambert | 10,017 | 21.18 | ||
| Conservative | C Welby | 9,295 | 19.65 | ||
| Plaid Cymru | Lindsay Whittle | 6,414 | 13.56 | ||
| Majority | 11,553 | 24.43 | |||
| Turnout | 74.51 | ||||
| Labour hold | Swing | ||||
Elections in the 1970s
| Party | Candidate | Votes | % | ± | |
|---|---|---|---|---|---|
| Labour | Ednyfed Hudson Davies | 27,280 | 58.76 | ||
| Conservative | JO Ranelagh | 8,783 | 18.92 | ||
| Plaid Cymru | Philip James Stradling Williams | 6,931 | 14.93 | ||
| Liberal | N Jones | 3,430 | 7.39 | ||
| Majority | 18,497 | 39.84 | |||
| Turnout | 78.81 | ||||
| Labour hold | Swing | ||||
| Party | Candidate | Votes | % | ± | |
|---|---|---|---|---|---|
| Labour | Alfred Thomas Evans | 24,161 | 56.59 | ||
| Plaid Cymru | Philip James Stradling Williams | 10,452 | 24.48 | ||
| Conservative | Den Dover | 4,897 | 11.47 | ||
| Liberal | NH Lewis | 3,184 | 7.46 | ||
| Majority | 13,709 | 32.11 | |||
| Turnout | 75.62 | ||||
| Labour hold | Swing | ||||
| Party | Candidate | Votes | % | ± | |
|---|---|---|---|---|---|
| Labour | Alfred Thomas Evans | 24,838 | 57.21 | ||
| Plaid Cymru | Philip James Stradling Williams | 11,956 | 27.54 | ||
| Conservative | R Everest | 5,912 | 13.62 | ||
| Independent | DH Bevan | 711 | 1.64 | ||
| Majority | 12,882 | 29.67 | |||
| Turnout | 77.51 | ||||
| Labour hold | Swing | ||||
| Party | Candidate | Votes | % | ± | |
|---|---|---|---|---|---|
| Labour | Alfred Thomas Evans | 24,972 | 61.82 | ||
| Plaid Cymru | Philip James Stradling Williams | 11,505 | 28.48 | ||
| Conservative | Peter Nicholas Price | 3,917 | 9.70 | ||
| Majority | 13,467 | 33.34 | |||
| Turnout | 78.07 | ||||
| Labour hold | Swing | ||||
Elections in the 1960s
| Party | Candidate | Votes | % | ± | |
|---|---|---|---|---|---|
| Labour | Alfred Thomas Evans | 16,148 | 45.66 | -28.59 | |
| Plaid Cymru | Philip James Stradling Williams | 14,274 | 40.36 | +29.22 | |
| Conservative | Robert Williams | 3,687 | 10.43 | -4.18 | |
| Liberal | Peter Sadler | 1,257 | 3.55 | N/A | |
| Majority | 1,874 | 5.3 | |||
| Labour hold | Swing | ||||
| Party | Candidate | Votes | % | ± | |
|---|---|---|---|---|---|
| Labour | Onesimus Edwards | 26,330 | 74.25 | ||
| Conservative | Ronald J Maddocks | 5,182 | 14.61 | ||
| Plaid Cymru | John D A Howell | 3,949 | 11.41 | ||
| Majority | 21,148 | 59.64 | |||
| Turnout | 76.79 | ||||
| Labour hold | Swing | ||||
| Party | Candidate | Votes | % | ± | |
|---|---|---|---|---|---|
| Labour | Onesimus Edwards | 26,001 | 72.14 | ||
| Conservative | Ronald J Maddocks | 6,086 | 16.89 | ||
| Plaid Cymru | Philip James Stradling Williams | 3,956 | 10.98 | ||
| Majority | 19,915 | 55.25 | |||
| Turnout | 78.41 | ||||
| Labour hold | Swing | ||||
Elections in the 1950s
| Party | Candidate | Votes | % | ± | |
|---|---|---|---|---|---|
| Labour | Onesimus Edwards | 28,154 | 72.65 | ||
| Conservative | W Russell Lewis | 7,181 | 18.53 | ||
| Plaid Cymru | John D A Howell | 3,420 | 8.82 | ||
| Majority | 20,973 | 54.12 | |||
| Turnout | 83.04 | ||||
| Labour hold | Swing | ||||
| Party | Candidate | Votes | % | ± | |
|---|---|---|---|---|---|
| Labour | Onesimus Edwards | 27,852 | 75.21 | ||
| Conservative | John H Davies | 9,180 | 24.79 | ||
| Majority | 18,672 | 50.42 | |||
| Turnout | 78.57 | ||||
| Labour hold | Swing | ||||
| Party | Candidate | Votes | % | ± | |
|---|---|---|---|---|---|
| Labour | Onesimus Edwards | 30,523 | 77.15 | ||
| Conservative | Kenneth Gordon Knee | 9,041 | 22.85 | ||
| Majority | 21,482 | 54.30 | |||
| Turnout | 84.37 | ||||
| Labour hold | Swing | ||||
| Party | Candidate | Votes | % | ± | |
|---|---|---|---|---|---|
| Labour | Onesimus Edwards | 30,270 | 77.53 | ||
| Conservative | KJ Lloyd | 8,771 | 22.47 | ||
| Majority | 21,499 | 55.07 | |||
| Turnout | 84.28 | ||||
| Labour hold | Swing | ||||
Election in the 1940s
| Party | Candidate | Votes | % | ± | |
|---|---|---|---|---|---|
| Labour | Onesimus Edwards | 29,158 | 80.22 | ||
| Conservative | John Frederick Manuel de Courcy | 7,189 | 19.78 | ||
| Majority | 21,969 | 60.44 | |||
| Turnout | 77.21 | ||||
| Labour hold | Swing | ||||
Elections in the 1930s
| Party | Candidate | Votes | % | ± | |
|---|---|---|---|---|---|
| Labour | Onesimus Edwards | 19,847 | |||
| Conservative | Ronald McMillan Bell | 9,349 | |||
| Majority | 10,498 | ||||
| Turnout | |||||
| Labour hold | Swing | ||||
| Party | Candidate | Votes | % | ± | |
|---|---|---|---|---|---|
| Labour | Morgan Jones | 24,846 | 76.25 | ||
| Conservative | Mrs GT Stoneham | 7,738 | 23,75 | ||
| Majority | 17,108 | 52.50 | |||
| Turnout | 72.32 | ||||
| Labour hold | Swing | ||||
| Party | Candidate | Votes | % | ± | |
|---|---|---|---|---|---|
| Labour | Morgan Jones | 23,061 | 67.62 | ||
| Conservative | Mrs Catherine Bowen-Davies | 11,044 | 32.38 | ||
| Majority | 12,017 | 35.24 | |||
| Turnout | 76.62 | ||||
| Labour hold | Swing | ||||
Elections in the 1920s
| Party | Candidate | Votes | % | ± | |
|---|---|---|---|---|---|
| Labour | Morgan Jones | 21,248 | 57.9 | -1.1 | |
| Liberal | Miss Alice Grace Roberts | 8,190 | 22.4 | n/a | |
| Unionist | Owen Temple-Morris | 6,357 | 17.4 | -23.6 | |
| Communist | J R Wilson | 829 | 2.3 | n/a | |
| Majority | 13,058 | 35.5 | +17.5 | ||
| Turnout | 81.1 | +1.8 | |||
| Labour hold | Swing | n/a | |||
| Party | Candidate | Votes | % | ± | |
|---|---|---|---|---|---|
| Labour | Morgan Jones | 17,723 | 59.0 | +0.3 | |
| Unionist | Gwilym Rowlands | 12,293 | 41.0 | +18.0 | |
| Majority | 5,430 | 18.0 | -17.7 | ||
| Turnout | 79.3 | +2.3 | |||
| Labour hold | Swing | -8.8 | |||
| Party | Candidate | Votes | % | ± | |
|---|---|---|---|---|---|
| Labour | Morgan Jones | 16,535 | 58.7 | +1.5 | |
| Unionist | Gwilym Rowlands | 6,493 | 23.0 | -19.8 | |
| Liberal | S.R. Jenkins | 5,152 | 18.3 | n/a | |
| Majority | 10,042 | 35.7 | +21.3 | ||
| Turnout | 77.0 | -1.6 | |||
| Labour hold | Swing | +10.6 | |||
| Party | Candidate | Votes | % | ± | |
|---|---|---|---|---|---|
| Labour | Morgan Jones | 13,759 | 57.2 | +3.0 | |
| Unionist | Alan McLean | 10,165 | 42.8 | n/a | |
| Majority | 4,025 | 14.4 | -4.3 | ||
| Turnout | 78.6 | +5.4 | |||
| Labour hold | Swing | n/a | |||
| Party | Candidate | Votes | % | ± | |
|---|---|---|---|---|---|
| Labour | Morgan Jones | 13,699 | 54.2 | -0.6 | |
| Liberal | William Rees Edmunds | 8,958 | 35.5 | -9.7 | |
| Communist | Robert J. Stewart | 2,592 | 10.3 | n/a | |
| Majority | 4,741 | 18.7 | +9.1 | ||
| Turnout | 73.2 | +9.2 | |||
| Labour hold | Swing | +4.5 | |||
Elections in the 1910s
| Party | Candidate | Votes | % | ± | |
|---|---|---|---|---|---|
| Labour | Alfred Onions | 11,496 | 54.8 | ||
| Liberal | William Rees Edmunds | 9,482 | 45.2 | ||
| Majority | 2,014 | 9.6 | |||
| Turnout | 64.0 | ||||
See also
Notes and references
- ↑ "Beyond 20/20 WDS - Table view". 2011 Electorate Figures. StatsWales. 1 December 2010. Retrieved 13 March 2011.
- ↑ Leigh Rayment's Historical List of MPs – Constituencies beginning with "C" (part 1)
- ↑ "Election Data 2015". Electoral Calculus. Archived from the original on 17 October 2015. Retrieved 17 October 2015.
- ↑ "Caerphilly result". General Election 2015 - Results for Caerphilly constituency. Caerphilly County Borough Council. Retrieved 21 September 2015.
- ↑ http://electionresults.blogspot.co.uk/2013/04/caerphilly-2015.html
- ↑ http://www.walesonline.co.uk/news/local-news/ukip-set-up-shop-merthyr-8305247
- ↑ https://meetyournextmp.com/human/1678-leo-docherty
- ↑ http://electionresults.blogspot.co.uk/2013/04/caerphilly-2015.html
- ↑ http://www.caerphillyobserver.co.uk/news/948560/green-party-reveal-caerphilly-and-islwyn-2015-general-election-candidates/
- ↑ http://www.libdems.org.uk/general_election_candidates#South West
- ↑ "Election Data 2010". Electoral Calculus. Archived from the original on 17 October 2015. Retrieved 17 October 2015.
- ↑ Caerphilly BBC Election - Caerphilly
- ↑ "Election Data 2005". Electoral Calculus. Archived from the original on 15 October 2011. Retrieved 18 October 2015.
- ↑ "Election Data 2001". Electoral Calculus. Archived from the original on 15 October 2011. Retrieved 18 October 2015.
- ↑ "Election Data 1997". Electoral Calculus. Archived from the original on 15 October 2011. Retrieved 18 October 2015.
- ↑ "Election Data 1992". Electoral Calculus. Archived from the original on 15 October 2011. Retrieved 18 October 2015.
- ↑ "Politics Resources". Election 1992. Politics Resources. 9 April 1992. Retrieved 2010-12-06.
- ↑ "Election Data 1987". Electoral Calculus. Archived from the original on 15 October 2011. Retrieved 18 October 2015.
- ↑ "Election Data 1983". Electoral Calculus. Archived from the original on 15 October 2011. Retrieved 18 October 2015.
- ↑ Craig, F. W. S. (1983). British parliamentary election results 1918-1949 (3 ed.). Chichester: Parliamentary Research Services. ISBN 0-900178-06-X.
- ↑ Craig, F. W. S. (1983). British parliamentary election results 1918-1949 (3 ed.). Chichester: Parliamentary Research Services. ISBN 0-900178-06-X.
- ↑ Craig, F. W. S. (1983). British parliamentary election results 1918-1949 (3 ed.). Chichester: Parliamentary Research Services. ISBN 0-900178-06-X.
- ↑ British Parliamentary Election Results 1918-1949, FWS Craig
This article is issued from Wikipedia - version of the 11/12/2016. The text is available under the Creative Commons Attribution/Share Alike but additional terms may apply for the media files.