Bretzwil
| Bretzwil | ||
|---|---|---|
 | ||
| ||
 Bretzwil | ||
|
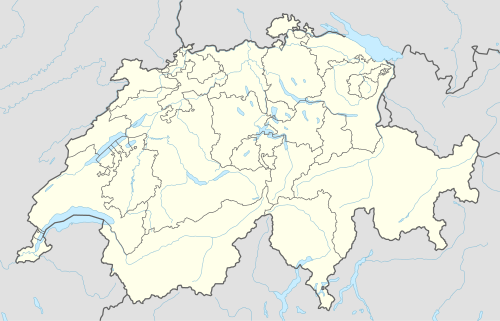
Location of Bretzwil  | ||
| Coordinates: 47°24′N 7°39′E / 47.400°N 7.650°ECoordinates: 47°24′N 7°39′E / 47.400°N 7.650°E | ||
| Country | Switzerland | |
| Canton | Basel-Landschaft | |
| District | Waldenburg | |
| Area[1] | ||
| • Total | 7.33 km2 (2.83 sq mi) | |
| Elevation | 628 m (2,060 ft) | |
| Population (Mar 2016[2]) | ||
| • Total | 778 | |
| • Density | 110/km2 (270/sq mi) | |
| Postal code | 4207 | |
| SFOS number | 2883 | |
| Surrounded by | Lauwil, Nunningen (SO), Reigoldswil, Seewen (SO) | |
| Website |
http://www.bretzwil.ch SFSO statistics | |

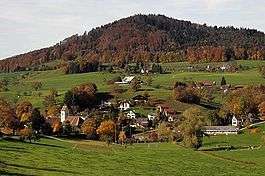
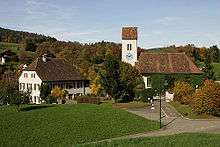
Bretzwil is a municipality in the district of Waldenburg in the canton of Basel-Country in Switzerland.
History
Bretzwil is first mentioned in 1194 as Braswilere. In 1247 it was mentioned as Brezwilr.[3]
Geography

Bretzwil has an area, as of 2009, of 7.33 square kilometers (2.83 sq mi). Of this area, 4.17 km2 (1.61 sq mi) or 56.9% is used for agricultural purposes, while 2.83 km2 (1.09 sq mi) or 38.6% is forested. Of the rest of the land, 0.35 km2 (0.14 sq mi) or 4.8% is settled (buildings or roads), 0.01 km2 (2.5 acres) or 0.1% is either rivers or lakes.[4]
Of the built up area, housing and buildings made up 3.8% and transportation infrastructure made up 0.8%. Out of the forested land, 35.9% of the total land area is heavily forested and 2.7% is covered with orchards or small clusters of trees. Of the agricultural land, 10.5% is used for growing crops and 35.1% is pastures, while 4.8% is used for orchards or vine crops and 6.5% is used for alpine pastures. All the water in the municipality is flowing water.[4]
The municipality is located in the Waldenburg district, at the base of the Jura Mountains.
Coat of arms
The blazon of the municipal coat of arms is Or, two Battons fleury Gules in saltire.[5]
Demographics

Bretzwil has a population (as of March 2016) of 778.[2] As of 2008, 7.2% of the population are resident foreign nationals.[6] Over the last 10 years (1997–2007) the population has changed at a rate of 8.5%.[7]
Most of the population (as of 2000) speaks German (669 or 94.0%), with Turkish being second most common (10 or 1.4%) and Serbo-Croatian being third (6 or 0.8%). There are 4 people who speak French.[8]
As of 2008, the gender distribution of the population was 49.7% male and 50.3% female. The population was made up of 729 Swiss citizens (92.7% of the population), and 57 non-Swiss residents (7.3%)[9] Of the population in the municipality 306 or about 43.0% were born in Bretzwil and lived there in 2000. There were 128 or 18.0% who were born in the same canton, while 201 or 28.2% were born somewhere else in Switzerland, and 58 or 8.1% were born outside of Switzerland.[8]
In 2008 there were 9 live births to Swiss citizens and were 4 deaths of Swiss citizens. Ignoring immigration and emigration, the population of Swiss citizens increased by 5 while the foreign population remained the same. There were 3 Swiss men and 2 Swiss women who emigrated from Switzerland. At the same time, there were 4 non-Swiss men and 3 non-Swiss women who immigrated from another country to Switzerland. The total Swiss population remained the same in 2008 and the non-Swiss population increased by 3 people. This represents a population growth rate of 0.4%.[6]
The age distribution, as of 2010, in Bretzwil is; 67 children or 8.5% of the population are between 0 and 6 years old and 141 teenagers or 17.9% are between 7 and 19. Of the adult population, 81 people or 10.3% of the population are between 20 and 29 years old. 83 people or 10.6% are between 30 and 39, 144 people or 18.3% are between 40 and 49, and 139 people or 17.7% are between 50 and 64. The senior population distribution is 95 people or 12.1% of the population are between 65 and 79 years old and there are 36 people or 4.6% who are over 80.[9]
As of 2000, there were 300 people who were single and never married in the municipality. There were 347 married individuals, 38 widows or widowers and 27 individuals who are divorced.[8]
As of 2000, there were 261 private households in the municipality, and an average of 2.7 persons per household.[7] There were 66 households that consist of only one person and 38 households with five or more people. Out of a total of 264 households that answered this question, 25.0% were households made up of just one person and 4 were adults who lived with their parents. Of the rest of the households, there are 74 married couples without children, 106 married couples with children There were 8 single parents with a child or children. There were 3 households that were made up unrelated people and 3 households that were made some sort of institution or another collective housing.[8]
In 2000 there were 152 single family homes (or 67.3% of the total) out of a total of 226 inhabited buildings. There were 26 multi-family buildings (11.5%), along with 42 multi-purpose buildings that were mostly used for housing (18.6%) and 6 other use buildings (commercial or industrial) that also had some housing (2.7%). Of the single family homes 29 were built before 1919, while 16 were built between 1990 and 2000. The greatest number of single family homes (45) were built between 1971 and 1980.[10]
In 2000 there were 291 apartments in the municipality. The most common apartment size was 5 rooms of which there were 85. There were 9 single room apartments and 132 apartments with five or more rooms. Of these apartments, a total of 248 apartments (85.2% of the total) were permanently occupied, while 29 apartments (10.0%) were seasonally occupied and 14 apartments (4.8%) were empty.[10] As of 2009, the construction rate of new housing units was 2.6 new units per 1000 residents.[7] As of 2000 the average price to rent a four-room apartment was 1274.00 CHF (US$1020, £570, €820).[11] The vacancy rate for the municipality, in 2010, was 0.31%.[7]
The historical population is given in the following chart:[3][12]

Politics
In the 2007 federal election the most popular party was the SVP which received 49.75% of the vote. The next three most popular parties were the SP (13.11%), the Green Party (11.24%) and the FDP (10.63%). In the federal election, a total of 265 votes were cast, and the voter turnout was 47.4%.[13]
Economy
As of 2010, Bretzwil had an unemployment rate of 2.2%. As of 2008, there were 68 people employed in the primary economic sector and about 23 businesses involved in this sector. 15 people were employed in the secondary sector and there were 5 businesses in this sector. 44 people were employed in the tertiary sector, with 18 businesses in this sector.[7] There were 366 residents of the municipality who were employed in some capacity, of which females made up 42.1% of the workforce.
In 2008 the total number of full-time equivalent jobs was 86. The number of jobs in the primary sector was 42, all of which were in agriculture. The number of jobs in the secondary sector was 13 of which 9 or (69.2%) were in manufacturing and 3 (23.1%) were in construction. The number of jobs in the tertiary sector was 31. In the tertiary sector; 7 or 22.6% were in wholesale or retail sales or the repair of motor vehicles, 10 or 32.3% were in a hotel or restaurant, 3 or 9.7% were in the information industry, 1 was a technical professional or scientist, 5 or 16.1% were in education and 1 was in health care.[14]
In 2000, there were 82 workers who commuted into the municipality and 249 workers who commuted away. The municipality is a net exporter of workers, with about 3.0 workers leaving the municipality for every one entering. About 9.8% of the workforce coming into Bretzwil are coming from outside Switzerland.[15] Of the working population, 12.6% used public transportation to get to work, and 59% used a private car.[7]
Religion
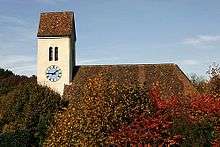
From the 2000 census, 90 or 12.6% were Roman Catholic, while 490 or 68.8% belonged to the Swiss Reformed Church. Of the rest of the population, there were 3 members of an Orthodox church (or about 0.42% of the population), there was 1 individual who belongs to the Christian Catholic Church, and there were 6 individuals (or about 0.84% of the population) who belonged to another Christian church. There were 21 (or about 2.95% of the population) who were Islamic. There was 1 person who was Buddhist and 3 individuals who were Hindu. 72 (or about 10.11% of the population) belonged to no church, are agnostic or atheist, and 25 individuals (or about 3.51% of the population) did not answer the question.[8]
Education

In Bretzwil about 274 or (38.5%) of the population have completed non-mandatory upper secondary education, and 50 or (7.0%) have completed additional higher education (either university or a Fachhochschule). Of the 50 who completed tertiary schooling, 84.0% were Swiss men, 14.0% were Swiss women.[8]
As of 2000, there was one student in Bretzwil who came from another municipality, while 57 residents attended schools outside the municipality.[15]
References
- ↑ Arealstatistik Standard - Gemeindedaten nach 4 Hauptbereichen
- 1 2 Canton of Basel-Land Statistics, Wohnbevölkerung nach Nationalität und Konfession per 31. März 2016 (German) accessed 30 August 201
- 1 2 Bretzwil in German, French and Italian in the online Historical Dictionary of Switzerland.
- 1 2 Swiss Federal Statistical Office-Land Use Statistics 2009 data (German) accessed 25 March 2010
- ↑ Flags of the World.com accessed 10-March-2011
- 1 2 Swiss Federal Statistical Office - Superweb database - Gemeinde Statistics 1981-2008 Archived June 28, 2010, at the Wayback Machine. (German) accessed 19 June 2010
- 1 2 3 4 5 6 Swiss Federal Statistical Office Archived January 5, 2016, at the Wayback Machine. accessed 10-March-2011
- 1 2 3 4 5 6 STAT-TAB Datenwürfel für Thema 40.3 - 2000 Archived August 9, 2013, at the Wayback Machine. (German) accessed 2 February 2011
- 1 2 Canton of Basel-Land Statistics, Wohnbevölkerung nach Nationalität und Konfession per 30. September 2010 (German) accessed 16 February 2011
- 1 2 Federal Statistical Office STAT-TAB - Datenwürfel für Thema 09.2 - Gebäude und Wohnungen Archived January 21, 2015, at the Wayback Machine. (German) accessed 28 January 2011
- ↑ Canton of Basel-Land Statistics Archived November 7, 2010, at the Wayback Machine., Mieter- und Genossenschafterwohnungen1 nach Zimmerzahl und Mietpreis 2000 (German) accessed 20 February 2011
- ↑ Swiss Federal Statistical Office STAT-TAB Bevölkerungsentwicklung nach Region, 1850-2000 Archived September 30, 2014, at the Wayback Machine. (German) accessed 29 January 2011
- ↑ Swiss Federal Statistical Office, Nationalratswahlen 2007: Stärke der Parteien und Wahlbeteiligung, nach Gemeinden/Bezirk/Canton Archived May 14, 2015, at the Wayback Machine. (German) accessed 28 May 2010
- ↑ Swiss Federal Statistical Office STAT-TAB Betriebszählung: Arbeitsstätten nach Gemeinde und NOGA 2008 (Abschnitte), Sektoren 1-3 Archived December 25, 2014, at the Wayback Machine. (German) accessed 28 January 2011
- 1 2 Swiss Federal Statistical Office - Statweb (German) accessed 24 June 2010
External links
- Bretzwil in German, French and Italian in the online Historical Dictionary of Switzerland.
| Wikimedia Commons has media related to Bretzwil. |