Blyth Valley (UK Parliament constituency)
This article is about the Parliamentary constituency. For the former local government district of the same name, see Blyth Valley.
| Blyth Valley | |
|---|---|
|
County constituency for the House of Commons | |
|
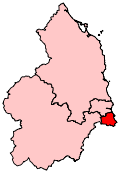
Boundary of Blyth Valley in Northumberland. | |
|
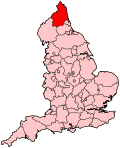
Location of Northumberland within England. | |
| County | Northumberland |
| Population | 82,174 (2011 census)[1] |
| Electorate | 63,173 (December 2010)[2] |
| Major settlements | Blyth, Cramlington, Seaton Delaval |
| Current constituency | |
| Created | 1950 |
| Member of parliament | Ronnie Campbell (Labour) |
| Number of members | One |
| Overlaps | |
| European Parliament constituency | North East England |
Blyth Valley (formerly known as Blyth) is a constituency[n 1] represented in the House of Commons of the UK Parliament since 1987 by Ronnie Campbell of the Labour Party.[n 2]
History
The constituency was established in 1950 as "Blyth", and renamed in 1983.
Boundaries
The constituency is based around the former borough of Blyth Valley, with Blyth as its main town.
Boundary review
Following their review of parliamentary representation in Northumberland, the Boundary Commission for England has made only minor changes to the existing constituencies in the region. Blyth Valley remains co-terminous with the boundaries of the former borough of the same name.
Members of Parliament
| Event | Member[3] | Party | |
|---|---|---|---|
| 1950 | Alfred Robens | Labour | |
| 1960 by-election | Eddie Milne | Labour | |
| Feb 1974 | Independent Labour | ||
| Oct 1974 | John Ryman | Labour | |
| 1987 | Ronnie Campbell | Labour | |
Elections
Elections in the 2010s
| Party | Candidate | Votes | % | ± | |
|---|---|---|---|---|---|
| Labour | Ronnie Campbell | 17,813 | 46.3 | +1.8 | |
| UKIP | Barry Elliott | 8,584 | 22.3 | +18.0 | |
| Conservative | Greg Munro | 8,346 | 21.7 | +5.1 | |
| Liberal Democrat | Philip Latham[5] | 2,265 | 5.9 | -21.3 | |
| Green | Dawn Furness[6] | 1,453 | 3.8 | +3.8 | |
| Majority | 9,229 | 24.0 | +6.3 | ||
| Turnout | 38,461 | 60.1 | +0.01 | ||
| Labour hold | Swing | -8.1% | |||
| Party | Candidate | Votes | % | ± | |
|---|---|---|---|---|---|
| Labour | Ronnie Campbell | 17,156 | 44.5 | −10.5 | |
| Liberal Democrat | Jeffrey Reid | 10,488 | 27.2 | −3.9 | |
| Conservative | Barry Flux | 6,412 | 16.6 | +2.7 | |
| BNP | Steve Fairbairn | 1,699 | 4.4 | +4.4 | |
| UKIP | Jim Condon | 1,665 | 4.3 | +4.3 | |
| Independent | Barry Elliott | 819 | 2.1 | +2.1 | |
| English Democrat | Allan White | 327 | 0.8 | +0.8 | |
| Majority | 6,668 | 17.3 | |||
| Turnout | 38,566 | 60.0 | +3.8 | ||
| Labour hold | Swing | -3.3% | |||
Elections in the 2000s
| Party | Candidate | Votes | % | ± | |
|---|---|---|---|---|---|
| Labour | Ronnie Campbell | 19,659 | 55.0 | −4.7 | |
| Liberal Democrat | Jeffrey Reid | 11,132 | 31.1 | +6.7 | |
| Conservative | Michael Windridge | 4,982 | 13.9 | −2.0 | |
| Majority | 8,527 | 23.8 | −11.5 | ||
| Turnout | 35,773 | 56.2 | +1.5 | ||
| Labour hold | Swing | -5.7 | |||
| Party | Candidate | Votes | % | ± | |
|---|---|---|---|---|---|
| Labour | Ronnie Campbell | 20,627 | 59.7 | −4.5 | |
| Liberal Democrat | Jeffrey Reid | 8,439 | 24.4 | +2.0 | |
| Conservative | Wayne Daley | 5,484 | 15.9 | +2.5 | |
| Majority | 12,188 | 35.3 | −6.5 | ||
| Turnout | 34,550 | 54.7 | −14.1 | ||
| Labour hold | Swing | +3.2 | |||
Elections in the 1990s
| Party | Candidate | Votes | % | ± | |
|---|---|---|---|---|---|
| Labour | Ronnie Campbell | 27,276 | 64.2 | +14.3 | |
| Liberal Democrat | Andrew Lamb | 9,540 | 22.5 | −11.0 | |
| Conservative | Barbara Musgrave | 5,666 | 13.3 | −2.3 | |
| Majority | 17,736 | 41.8 | 25.4 | ||
| Turnout | 42,482 | 68.8 | −12.0 | ||
| Labour hold | Swing | +12.7 | |||
| Party | Candidate | Votes | % | ± | |
|---|---|---|---|---|---|
| Labour | Ronnie Campbell | 24,542 | 49.9 | +7.4 | |
| Liberal Democrat | Peter M. Tracey | 16,498 | 33.5 | −7.1 | |
| Conservative | Michael J. Revell | 7,691 | 15.6 | −1.3 | |
| Green | Stephen P. Tyley | 470 | 1.0 | +1.0 | |
| Majority | 8,044 | 16.3 | +14.5 | ||
| Turnout | 49,201 | 80.7 | +2.6 | ||
| Labour hold | Swing | +7.3 | |||
Elections in the 1980s
| Party | Candidate | Votes | % | ± | |
|---|---|---|---|---|---|
| Labour | Ronnie Campbell | 19,604 | 42.5 | +3.0 | |
| Social Democratic | Rosemary Margaret Brownlow | 18,751 | 40.6 | +8.8 | |
| Conservative | Robert Richard Francis Kinghorn | 7,823 | 16.9 | −10.9 | |
| Majority | 853 | 1.9 | −5.8 | ||
| Turnout | 46,178 | 78.1 | +5.3 | ||
| Labour hold | Swing | ||||
| Party | Candidate | Votes | % | ± | |
|---|---|---|---|---|---|
| Labour | John Ryman | 16,583 | 39.5 | −0.6 | |
| Social Democratic | Rosemary Margaret Brownlow | 13,340 | 31.8 | +31.8 | |
| Conservative | Andrew Hargreaves | 11,657 | 27.8 | +5.0 | |
| Independent | S. Robinson | 406 | 0.9 | +0.9 | |
| Majority | 3,243 | 7.7 | −3.6 | ||
| Turnout | 41,986 | 72.8 | −5.5 | ||
| Labour hold | Swing | ||||
Elections in the 1970s
| Party | Candidate | Votes | % | ± | |
|---|---|---|---|---|---|
| Labour | John Ryman | 25,047 | 40.1 | +3.4 | |
| Independent Labour | Eddie Milne | 17,987 | 28.8 | −7.8 | |
| Conservative | Emma Harriet Nicholson | 14,194 | 22.8 | +10.9 | |
| Liberal | D. Parkin | 5,176 | 8.29 | −6.5 | |
| Majority | 7,060 | 11.3 | +11.2 | ||
| Turnout | 62,404 | 78.3 | -4.0 | ||
| Labour hold | Swing | ||||
| Party | Candidate | Votes | % | ± | |
|---|---|---|---|---|---|
| Labour | John Ryman | 20,308 | 36.7 | ||
| Independent Labour | Eddie Milne | 20,230 | 36.6 | ||
| Liberal | John Shipley | 8,177 | 14.8 | ||
| Conservative | B. Griffiths | 6,590 | 11.9 | ||
| Majority | 78 | 0.1 | |||
| Turnout | 55,305 | 74.3 | |||
| Labour gain from Independent Labour | Swing | ||||
| Party | Candidate | Votes | % | ± | |
|---|---|---|---|---|---|
| Independent Labour | Eddie Milne | 22,918 | 38.9 | ||
| Labour | Ivor Richard | 16,778 | 28.5 | ||
| Liberal | John Shipley | 10,214 | 17.4 | ||
| Conservative | B. Griffiths | 8,888 | 15.1 | ||
| Majority | 6,140 | 10.4 | |||
| Turnout | 58,798 | 79.5 | |||
| Independent Labour gain from Labour | Swing | ||||
| Party | Candidate | Votes | % | ± | |
|---|---|---|---|---|---|
| Labour | Eddie Milne | 36,118 | 74.2 | ||
| Conservative | A.J. Blackburn | 12,550 | 25.8 | ||
| Majority | 23,568 | 48.4 | |||
| Turnout | 48,668 | 71.6 | |||
| Labour hold | Swing | ||||
Elections in the 1960s
| Party | Candidate | Votes | % | ± | |
|---|---|---|---|---|---|
| Labour | Eddie Milne | 36,493 | 78.2 | ||
| Conservative | W.J. Prime | 10,179 | 21.8 | ||
| Majority | 26,314 | 56.4 | |||
| Turnout | 46,672 | 74.4 | |||
| Labour hold | Swing | ||||
| Party | Candidate | Votes | % | ± | |
|---|---|---|---|---|---|
| Labour | Eddie Milne | 37,336 | 75.9 | ||
| Conservative | G.P. Davidson | 11,832 | 24.1 | ||
| Majority | 25,504 | 51.9 | |||
| Turnout | 49,168 | 78.3 | |||
| Labour hold | Swing | ||||
| Party | Candidate | Votes | % | ± | |
|---|---|---|---|---|---|
| Labour | Eddie Milne | 23,438 | 68.9% | -5.7% | |
| Conservative | Dennis Murray Walters | 7,366 | 21.6% | -3.8% | |
| Independent | C. Pym | 3,223 | 9.5% | N/A | |
| Labour hold | Swing | N/A | |||
Elections in the 1950s
| Party | Candidate | Votes | % | ± | |
|---|---|---|---|---|---|
| Labour | Alfred Robens | 38,616 | 74.6 | ||
| Conservative | Dennis Murray Walters | 13,122 | 25.4 | ||
| Majority | 25,494 | 49.3 | |||
| Turnout | 51,738 | 82.7 | |||
| Labour hold | Swing | ||||
| Party | Candidate | Votes | % | ± | |
|---|---|---|---|---|---|
| Labour | Alfred Robens | 36,522 | 73.1 | ||
| Conservative | Nicholas Ridley | 13,429 | 26.9 | ||
| Majority | 23,093 | 46.2 | |||
| Turnout | 49,951 | 80.3 | |||
| Labour hold | Swing | ||||
| Party | Candidate | Votes | % | ± | |
|---|---|---|---|---|---|
| Labour | Alfred Robens | 39,823 | 73.7 | -1.0 | |
| Conservative | G. Peters | 14,184 | 26.3 | 0.9 | |
| Majority | 25,693 | 47.5 | −1.8 | ||
| Turnout | 54,007 | 86.25 | -0.72 | ||
| Labour hold | Swing | ||||
| Party | Candidate | Votes | % | ± | |
|---|---|---|---|---|---|
| Labour | Alfred Robens | 40,245 | 74.7 | N/A | |
| Conservative | L.J. Amos | 13,665 | 25.4 | N/A | |
| Majority | 26,580 | 49.3 | N/A | ||
| Turnout | 53,910 | 86.97 | N/A | ||
| Labour win (new seat) | |||||
See also
Notes and references
- Notes
- ↑ A county constituency (for the purposes of election expenses and type of returning officer)
- ↑ As with all constituencies, the constituency elects one Member of Parliament (MP) by the first past the post system of election at least every five years.
- References
- ↑ "Blyth Valley: Usual Resident Population, 2011". Neighbourhood Statistics. Office for National Statistics. Retrieved 31 January 2015.
- ↑ "Electorate Figures - Boundary Commission for England". 2011 Electorate Figures. Boundary Commission for England. 4 March 2011. Archived from the original on 6 November 2010. Retrieved 13 March 2011.
- ↑ Leigh Rayment's Historical List of MPs – Constituencies beginning with "B" (part 2)
- ↑ "Election Data 2015". Electoral Calculus. Archived from the original on 17 October 2015. Retrieved 17 October 2015.
- ↑ "Candidate is selected". News Post Leader. 6 January 2015. Retrieved 20 January 2015.
- ↑ "Archived copy". Archived from the original on 2015-04-02. Retrieved 2015-03-27.
- ↑ "Election Data 2010". Electoral Calculus. Archived from the original on 17 October 2015. Retrieved 17 October 2015.
- ↑ "Election Data 2005". Electoral Calculus. Archived from the original on 15 October 2011. Retrieved 18 October 2015.
- ↑ "Election Data 2001". Electoral Calculus. Archived from the original on 15 October 2011. Retrieved 18 October 2015.
- ↑ "Election Data 1997". Electoral Calculus. Archived from the original on 15 October 2011. Retrieved 18 October 2015.
- ↑ "Election Data 1992". Electoral Calculus. Archived from the original on 15 October 2011. Retrieved 18 October 2015.
- ↑ "Politics Resources". Election 1992. Politics Resources. 9 April 1992. Retrieved 2010-12-06.
- ↑ "Election Data 1987". Electoral Calculus. Archived from the original on 15 October 2011. Retrieved 18 October 2015.
- ↑ "Election Data 1983". Electoral Calculus. Archived from the original on 15 October 2011. Retrieved 18 October 2015.
External links
- nomis Constituency Profile for Blyth Valley presenting data from the ONS annual population survey and other official statistics.
Coordinates: 55°07′37″N 1°31′23″W / 55.127°N 1.523°W
This article is issued from Wikipedia - version of the 12/4/2016. The text is available under the Creative Commons Attribution/Share Alike but additional terms may apply for the media files.