Belgian federal election, 1999
Belgium federal election, 1999
.svg.png)
|
| 13 June 1999 (1999-06-13) |
|
|
All 150 seats in the Chamber of Representatives
40 of 71 seats in the Senate
respectively 76 and 36 seats needed for a majority |
| |
First party |
Second party |
Third party |
| |
 |
 |
 |
| Leader |
Guy Verhofstadt |
Jean-Luc Dehaene^ |
Elio Di Rupo |
| Party |
VLD |
CVP |
PS |
| Leader since |
1997 |
Candidate for PM |
1999 |
| Leader's seat |
Dendermonde |
Vilvoorde |
Mons |
| Last election |
21 seats, 13.1% |
29 seats, 17.18% |
21 seats, 11.87% |
| Seats before |
21 |
29 |
21 |
| Seats won |
23 |
22 |
19 |
| Seat change |
 2 2 |
 7 7 |
2 |
| Popular vote |
888,861 |
875,455 |
631,653 |
| Percentage |
14.3% |
14.09% |
10.16% |
| Swing |
1.15% |
3.09% |
1.71% |
|
| |
Fourth party |
Fifth party |
Sixth party |
| |
 |
 |
|
| Leader |
Louis Michel |
Frank Vanhecke |
Fred Erdman |
| Party |
PRL + FDF |
VB |
SP |
| Leader since |
1995 |
1996 |
1998 |
| Leader's seat |
Jodoigne |
Antwerp |
Antwerp |
| Last election |
18 seats, 10.26% |
11 seats, 7.83% |
14 seats, 12.56% |
| Seats before |
18 |
11 |
20 |
| Seats won |
18 |
15 |
14 |
| Seat change |
 |
4 |
6 |
| Popular vote |
630,219 |
613,399 |
593,372 |
| Percentage |
10.14% |
9.87% |
9.55% |
| Swing |
0.12% |
2.04% |
3.01% |
|
|
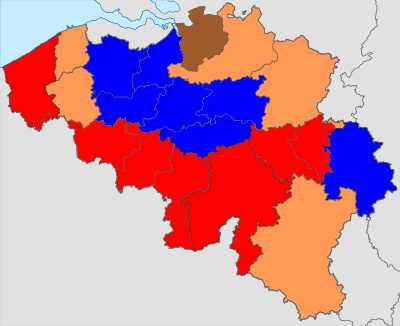
| Colours denote the winning party in each electoral district, as shown in the table of results. |
|
|
The June 13, 1999 Belgian federal elections was a Belgian election for the Belgian Chamber of Representatives and Belgian Senate. The federal general elections were held on the same day as the European elections and the regional elections. The Flemish Liberals and Democrats (VLD) became the largest party.
The Christian Democrats (CVP/PSC) suffered historic losses due to the dioxine affair that broke loose that year. Jean-Luc Dehaene's reign of eight years came to an end. Verhofstadt formed a six-party coalition comprising the liberal (VLD and PRL), socialist (SP and PS), and green parties (Agalev and Ecolo). It was the first liberal-led government since 1938, and the first since 1958 that didn't include a Christian Democratic party.
Chamber of Representatives
Summary of the 13 June 1999 Belgian Chamber of Representatives election results
| ← 1995 • 1999 • 2003 → |
| Party |
Main ideology |
Leader(s) |
Votes |
% |
+/– |
E.c. % |
Seats |
+/– |
|
Flemish Liberals and Democrats (VLD) |
Liberalism |
Guy Verhofstadt |
888,861 |
14.30 |
1.15 |
|
23 |
2 |
|
Christian People's Party (CVP) |
Christian democracy |
Marc Van Peel |
875,455 |
14.09 |
3.09 |
|
22 |
7 |
|
Socialist Party (Wallonia) (PS) |
Social democracy |
Elio Di Rupo |
631,653 |
10.16 |
1.71 |
|
19 |
2 |
|
Liberal Reformist Party (PRL) + Democratic Front of Francophones (FDF) |
Liberalism |
Louis Michel |
630,219 |
10.14 |
0.12 |
|
18 |
0 |
|
Flemish Block (VB) |
Flemish nationalism |
Frank Vanhecke |
613,399 |
9.87 |
2.04 |
|
15 |
4 |
|
Socialist Party (Flanders) (SP) |
Social democracy |
Fred Erdman |
593,372 |
9.55 |
3.01 |
|
14 |
6 |
|
Confederated Ecologists (ECOLO) |
Green politics |
Isabelle Durant |
457,281 |
7.36 |
3.35 |
|
11 |
5 |
|
Living Differently (AGALEV) |
Green politics |
Jos Geysels |
434,449 |
6.99 |
2.56 |
|
9 |
4 |
|
Christian Social Party (PSC) |
Christian democracy |
Philippe Maystadt |
365,318 |
5.88 |
1.85 |
|
10 |
2 |
|
People's Union–ID (VU-ID) |
Flemish nationalism |
Patrik Vankrunkelsven |
345,576 |
5.56 |
0.86 |
|
8 |
3 |
|
National Front (FN) |
Nationalism |
|
90,401 |
1.45 |
0.83 |
|
1 |
1 |
|
Vivant (VIVANT) |
Social liberalism |
Roland Duchâtelet |
130,701 |
2.10 |
new |
— |
— |
— |
| |
Others (parties that received less than 1% of the national vote) |
157,389 |
2.53 |
— |
— |
— |
— |
| Valid votes |
6,214,074 |
93.44 |
|
| Blank and invalid votes |
435,941 |
6.56 |
| Totals |
6,650,015 |
100.00 |
— |
— |
150 |
— |
| Electorate and voter turnout |
7,343,464 |
90.56 |
|
| Source: 1999 Federal Election. |
Senate
Summary of the 13 June 1999 Belgian Senate election results
| Parties |
Senate |
| Votes | +/- | % | +/- | Seats | +/- |
|
Flemish Liberals and Democrats (Vlaamse Liberalen en Democraten) | 952,116 | | 15.4 | | 6 | ± 0 |
|
Christian People's Party (Christelijke Volkspartij) | 913,508 | | 14.7 | | 6 | - 1 |
|
Liberal Reformist Party–Democratic Front of Francophones (PRL–FDF) | 654,961 | | 10.6 | | 5 | ± 0 |
|
Socialist Party (Wallonia) (Parti Socialiste) | 597,890 | | 9.7 | | 4 | - 1 |
|
Flemish Block (Vlaams Blok) | 583,208 | | 9.4 | | 4 | + 1 |
|
Socialist Party (Flanders) (Socialistische Partij) | 550,657 | | 8.9 | | 4 | - 2 |
|
Ecolo | 458,658 | | 7.4 | | 3 | + 1 |
|
Agalev | 438,931 | | 7.1 | | 3 | + 2 |
|
Christian Social Party (Parti Social Chrétien) | 374,002 | | 6.0 | | 3 | ± 0 |
|
VU&ID | 317,830 | | 5.1 | | 2 | ± 0 |
|
Vivant (total) | 123,498 | | 2.0 | | – | |
|
National Front (Front National) | 92,924 | | 1.5 | | – | |
|
Workers Party of Belgium (total) | 35,493 | | 0.6 | | – | |
|
FNB (Front Nouveau de Belgique) | 23,382 | | 0.4 | | – | |
|
Communist Party (Parti Communiste) | 21,991 | | 0.4 | | – | |
|
PNPB (Paul Marchal) | 26,124 | | 0.5 | | – | |
|
Other | 29,198 | — | 0.5 | — | — | — |
| Total (turnout 90.6%) |
6,194,371 |
|
100 |
|
40 |
|
| Source: IBZ. |