Batley and Morley (UK Parliament constituency)
| Batley and Morley | |
|---|---|
|
Former constituency for the House of Commons | |
| 1918–1983 | |
| Number of members | one |
| Replaced by | Batley and Spen and Morley and Leeds South |
| Created from | Morley |
Batley and Morley was a parliamentary constituency centred on the towns of Batley and Morley in West Yorkshire. It returned one Member of Parliament to the House of Commons of the Parliament of the United Kingdom.
The constituency was created for the 1918 general election, and abolished for the 1983 general election. It was then replaced by the seats of Batley and Spen & Morley and Leeds South.
Boundaries
1918-1950: The Municipal Boroughs of Batley, Morley, and Ossett.
1950-1983: The Municipal Boroughs of Batley and Morley.
Members of Parliament
| Election | Member | Party | |
|---|---|---|---|
| 1918 | Gerald Ashburner France | Coalition Liberal | |
| 1922 | Ben Turner | Labour | |
| 1924 | Walter Forrest | Liberal | |
| 1929 | Sir Ben Turner | Labour | |
| 1931 | Wilfrid Dewhurst Wills | Conservative | |
| 1935 | Willie Brooke | Labour | |
| 1939 by-election | Hubert Beaumont | Labour | |
| 1949 by-election | Sir Alfred Broughton | Labour | |
| 1979 | Ken Woolmer | Labour | |
| 1983 | constituency abolished | ||
Elections
Elections in the 1910s
| Party | Candidate | Votes | % | ± | |
|---|---|---|---|---|---|
| Liberal | 13,519 | 52.9 | n/a | ||
| Labour | Benjamin Turner | 12,051 | 47.1 | n/a | |
| Majority | 1,468 | 5.8 | n/a | ||
| Turnout | 66.9 | n/a | |||
| Liberal win | |||||
- endorsed by Coalition Government
Elections in the 1920s
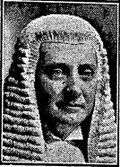
J.A. Compston
| Party | Candidate | Votes | % | ± | |
|---|---|---|---|---|---|
| Labour | Benjamin Turner | 15,005 | 46.1 | ||
| Liberal | John Albert Compston | 9,943 | 29.1 | ||
| Unionist | John Potter | 8,054 | 24.8 | ||
| Majority | 5,562 | 17.0 | |||
| Turnout | 85.2 | ||||
| Labour hold | Swing | ||||
| Party | Candidate | Votes | % | ± | |
|---|---|---|---|---|---|
| Labour | Benjamin Turner | 14,964 | 52.6 | +6.5 | |
| Liberal | Walter Forrest | 13,480 | 47.4 | +18.3 | |
| Majority | 1,484 | 5.2 | -11.8 | ||
| Turnout | 28,444 | 73.8 | -11.4 | ||
| Labour hold | Swing | -5.9 | |||
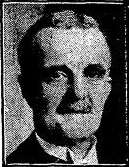
Walter Forrest
| Party | Candidate | Votes | % | ± | |
|---|---|---|---|---|---|
| Liberal | Walter Forrest | 16,369 | 50.6 | +3.2 | |
| Labour | Benjamin Turner | 15,966 | 49.4 | -3.2 | |
| Majority | 403 | 1.2 | |||
| Turnout | 32,335 | 83.3 | + | ||
| Liberal gain from Labour | Swing | ||||
| Party | Candidate | Votes | % | ± | |
|---|---|---|---|---|---|
| Labour | Sir Benjamin Turner | 24,621 | 58.3 | +8.9 | |
| Liberal | Walter Forrest | 17,641 | 41.7 | -8.9 | |
| Majority | 6,980 | 16.6 | 17.8 | ||
| Turnout | 84.1 | +0.8 | |||
| Labour gain from Liberal | Swing | +8.9 | |||
Elections in the 1930s
| Party | Candidate | Votes | % | ± | |
|---|---|---|---|---|---|
| Conservative | Wilfrid Dewhurst Wills | 26,378 | 61.2 | ||
| Labour | Sir Benjamin Turner | 16,700 | 38.8 | ||
| Majority | 9,678 | 22.4 | |||
| Turnout | 85.9 | ||||
| Conservative gain from Labour | Swing | ||||
| Party | Candidate | Votes | % | ± | |
|---|---|---|---|---|---|
| Labour | Willie Brooke | 21,182 | 53.6 | ||
| Conservative | Wilfrid Dewhurst Wills | 18,354 | 46.4 | ||
| Majority | 2,828 | 7.2 | |||
| Turnout | 79.3 | ||||
| Labour gain from Conservative | Swing | ||||
| Party | Candidate | Votes | % | ± | |
|---|---|---|---|---|---|
| Labour | Hubert Beaumont | 20,020 | 55.4 | ||
| Conservative | Wilfrid Dewhurst Wills | 16,124 | 44.6 | ||
| Majority | |||||
| Turnout | 72.6 | ||||
| Labour hold | Swing | ||||
- Liberal Party candidate Ernest Dalton withdrew
Elections in the 1940s
| Party | Candidate | Votes | % | ± | |
|---|---|---|---|---|---|
| Labour | Hubert Beaumont | 22,682 | 58.1 | ||
| Conservative | G W Hirst | 11,090 | 28.4 | ||
| Liberal | Ashley Mitchell | 5,256 | 13.5 | ||
| Majority | 11,592 | 29.7 | |||
| Turnout | 39,028 | 80.9 | |||
| Labour hold | Swing | ||||
| Party | Candidate | Votes | % | ± | |
|---|---|---|---|---|---|
| Labour | Alfred Davies Devonsher Broughton | 24,514 | 59.3 | ||
| Conservative | Arthur Maxwell Ramsden | 16,828 | 40.7 | ||
| Majority | 7,686 | 18.6 | |||
| Turnout | |||||
| Labour hold | Swing | ||||
Elections in the 1950s
| Party | Candidate | Votes | % | ± | |
|---|---|---|---|---|---|
| Labour | Alfred Davies Devonsher Broughton | 29,776 | 59.95 | +1.83 | |
| Conservative | Mrs. W.C.G. Bremner | 19,891 | 40.05 | +11.63 | |
| Majority | 9,885 | 19.90 | -9.80 | ||
| Turnout | 49,667 | 87.03 | +6.15 | ||
| Registered electors | 57,066 | ||||
| Labour hold | Swing | -4.90 | |||
| Party | Candidate | Votes | % | ± | |
|---|---|---|---|---|---|
| Labour | Alfred Davies Devonsher Broughton | 29,326 | 59.68 | -0.27 | |
| Conservative | Reginald Northam | 19,811 | 40.32 | +0.27 | |
| Majority | 9,515 | 19.36 | -0.54 | ||
| Turnout | 49,137 | 85.53 | -1.50 | ||
| Registered electors | 57,453 | ||||
| Labour hold | Swing | -0.27 | |||
| Party | Candidate | Votes | % | ± | |
|---|---|---|---|---|---|
| Labour | Alfred Davies Devonsher Broughton | 27,178 | 60.20 | +0.52 | |
| Conservative | Harry Watson | 17,970 | 39.80 | -0.52 | |
| Majority | 9,208 | 20.40 | +1.04 | ||
| Turnout | 45,148 | 79.89 | -5.64 | ||
| Registered electors | 56,513 | ||||
| Labour hold | Swing | +0.52 | |||
| Party | Candidate | Votes | % | ± | |
|---|---|---|---|---|---|
| Labour | Alfred Davies Devonsher Broughton | 26,781 | 58.35 | -1.85 | |
| Conservative | Mrs Barbara M Garden | 19,115 | 41.65 | +1.85 | |
| Majority | 7,666 | 16.70 | -3.70 | ||
| Turnout | 45,896 | 81.91 | +2.02 | ||
| Registered electors | 56,031 | ||||
| Labour hold | Swing | -1.85 | |||
Elections in the 1960s
| Party | Candidate | Votes | % | ± | |
|---|---|---|---|---|---|
| Labour | Alfred Davies Devonsher Broughton | 23,362 | 52.61 | -5.74 | |
| Conservative | Peter JD Marshall | 13,477 | 30.35 | -11.3 | |
| Liberal | Ivan H Lester | 7,564 | 17.03 | N/A | |
| Majority | 9,885 | 16.70 | +5.56 | ||
| Turnout | 44,403 | 78.68 | -3.23 | ||
| Registered electors | 56,436 | ||||
| Labour hold | Swing | +2.78 | |||
| Party | Candidate | Votes | % | ± | |
|---|---|---|---|---|---|
| Labour | Alfred Davies Devonsher Broughton | 24,086 | 56.16 | +3.55 | |
| Conservative | Peter JD Marshall | 12,435 | 28.99 | -1.36 | |
| Liberal | EA Berry | 6,366 | 14.84 | -2.19 | |
| Majority | 11,651 | 16.70 | +10.47 | ||
| Turnout | 42,887 | 78.68 | -3.36 | ||
| Registered electors | 56,936 | ||||
| Labour hold | Swing | +2.46 | |||
Elections in the 1970s
| Party | Candidate | Votes | % | ± | |
|---|---|---|---|---|---|
| Labour | Alfred Davies Devonsher Broughton | 23,024 | 50.41 | ||
| Conservative | Donald Thompson | 15,753 | 34.49 | ||
| Liberal | Peter Wrigley | 6,893 | 15.09 | ||
| Majority | 7,271 | 15.92 | |||
| Turnout | 72.39 | ||||
| Party | Candidate | Votes | % | ± | |
|---|---|---|---|---|---|
| Labour | Alfred Davies Devonsher Broughton | 21,495 | 44.60 | ||
| Conservative | George Neill Alexander Crone | 14,404 | 29.89 | ||
| Liberal | Peter Wrigley | 11,470 | 23.80 | ||
| Independent Democratic Alliance | Gerald Jarratt | 828 | 1.72 | ||
| Majority | 7,091 | 14.71 | |||
| Turnout | 48,197 | 78.34 | |||
| Labour hold | Swing | ||||
| Party | Candidate | Votes | % | ± | |
|---|---|---|---|---|---|
| Labour | Alfred Davies Devonsher Broughton | 21,179 | 49.21 | +4.61 | |
| Conservative | George Neill Alexander Crone | 12,931 | 30.05 | +0.16 | |
| Liberal | Ivan Harvey Lester | 8,928 | 20.74 | -3.05 | |
| Majority | 8,248 | 19.16 | |||
| Turnout | 43,038 | 69.55 | |||
| Labour hold | Swing | ||||
| Party | Candidate | Votes | % | ± | |
|---|---|---|---|---|---|
| Labour | Kenneth John Woolmer | 22,984 | 49.04 | -0.17 | |
| Conservative | George Neill Alexander Crone | 17,632 | 37.62 | +7.58 | |
| Liberal | Christopher Julian Cawood | 4,943 | 10.55 | -10.20 | |
| Independent Labour | Douglas Parkin | 848 | 1.81 | N/A | |
| Ecology | Clive Richard Lord | 460 | 0.98 | N/A | |
| Majority | 5,352 | 11.42 | |||
| Turnout | 46,867 | 74.54 | |||
| Labour hold | Swing | ||||
References
- 1 2 3 4 5 6 7 8 9 10 British parliamentary election results 1918-1949, Craig
- ↑ Kimber, Richard. "UK General Election results 1950". Political Science Resources. Retrieved 13 April 2016.
- ↑
- ↑ Kimber, Richard. "UK General Election results 1951". Political Science Resources. Retrieved 13 April 2016.
- ↑
- ↑ Kimber, Richard. "UK General Election results 1955". Political Science Resources. Retrieved 13 April 2016.
- ↑
- ↑ Kimber, Richard. "UK General Election results 1959". Political Science Resources. Retrieved 13 April 2016.
- ↑
- ↑ Kimber, Richard. "UK General Election results 1964". Political Science Resources. Retrieved 13 April 2016.
- ↑
- ↑ Kimber, Richard. "UK General Election results 1966". Political Science Resources. Retrieved 13 April 2016.
- ↑
- ↑ "UK General Election results 1970". Politics Resources. Retrieved 15 March 2016.
- 1 2 3 "'Batley and Morley', Feb 1974 - May 1983". ElectionWeb Project. Cognitive Computing Limited. Archived from the original on 18 March 2016. Retrieved 15 March 2016.
- ↑ "UK General Election results February 1974". Politics Resources. Retrieved 15 March 2016.
- ↑ "UK General Election results October 1974". Politics Resources. Retrieved 15 March 2016.
- ↑ "UK General Election results May 1974". Politics Resources. Retrieved 15 March 2016.
This article is issued from Wikipedia - version of the 10/28/2016. The text is available under the Creative Commons Attribution/Share Alike but additional terms may apply for the media files.