Polar low

A polar low is a small-scale, short-lived atmospheric low pressure system (depression) that is found over the ocean areas poleward of the main polar front in both the Northern and Southern Hemispheres. The systems usually have a horizontal length scale of less than 1,000 kilometres (620 mi) and exist for no more than a couple of days. They are part of the larger class of mesoscale weather systems. Polar lows can be difficult to detect using conventional weather reports and are a hazard to high-latitude operations, such as shipping and gas and oil platforms. Such winter storms can cause bitter cold and crop freezes. Polar lows have been referred to by many other terms, such as polar mesoscale vortex, Arctic hurricane, Arctic low, and cold air depression. Today the term is usually reserved for the more vigorous systems that have near-surface winds of at least 17 m/s (38 mph).[1]
History
Polar lows were first identified on the meteorological satellite imagery that became available in the 1960s, which revealed many small-scale cloud vortices at high latitudes. The most active polar lows are found over certain ice-free maritime areas in or near the Arctic during the winter, such as the Norwegian Sea, Barents Sea, Labrador Sea and Gulf of Alaska; however, some polar lows have been found in the Sea of Japan. Polar lows dissipate rapidly when they make landfall. Antarctic systems tend to be weaker than their northern counterparts since the air-sea temperature differences around the continent are generally smaller. However, vigorous polar lows can be found over the Southern Ocean.
Structure
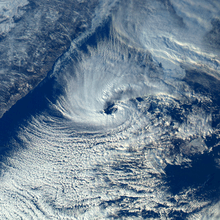
Polar lows can have a wide range of cloud signatures in satellite imagery, but two broad categories of cloud forms have been identified. The first is the "spiraliform" signature consisting of a number of cloud bands wrapped around the centre of the low. Some polar lows have the appearance in satellite imagery of tropical cyclones, with deep thunderstorm clouds surrounding a cloud-free ‘eye’, which has given rise to the use of the term "Arctic hurricane" to describe some of the more active lows. These systems are more common deep within the polar air. The second is a "comma-shaped" signature that is found more frequently with systems closer to the polar front.
Formation
Polar lows form for a number of different reasons, and a spectrum of systems is observed on satellite imagery. A number of lows develop on horizontal temperature gradients through baroclinic instability, and these can have the appearance of small frontal depressions. At the other extreme are the polar lows with extensive cumulonimbus clouds, which are often associated with cold pools in the mid- to upper-troposphere. During winter, when cold-core lows with temperatures in the mid-levels of the troposphere reach −45 °C (−49 °F) move over open waters, deep convection forms which allows polar low development to become possible.[2]
Frequency
Polar lows can occur at any time during the year, but cyclogenesis takes on different characteristics depending on season.
Winter cyclones
Although cyclonic activity is most prevalent in the Eurasian Arctic with approximately 15 cyclones per winter, polar lows also occur in Greenland and the Canadian Arctic.
Summer cyclones
If you get the right atmospheric conditions during those two months, they can really accelerate the ice loss. If you don’t, they can slow down any melting momentum you had. So our predictive ability in May of the September minimum is limited, because the sea ice cover is so sensitive to the early-to-mid-summer atmospheric conditions, and you can’t foresee summer weather.— Walt Meier, a sea ice scientist at NASA’s Goddard Space Flight Center[3]
In stark contrast, summer polar cyclones may not form for several years, and tend to be weaker than winter cyclones.[4] Nevertheless, summer cyclones can still rival concurrent tropical cyclones within the same hemisphere in pressure, such as 968 mb for the August 2016 cyclone, and 962 mb for the Great Arctic Cyclone of 2012.
One summer cyclone swept across the US in August 2016, with a central pressure of 968 mb[5] These cyclones cause arctic sea ice to melt as they kick up winds that cause ice to break up, the lowest extent of ice in the arctic ever recorded was 2012, when the Great Arctic Cyclone of 2012 hit the region.
Summer cyclones are not well studied and seldom destructive in terms of lives or property as they typically take place in sparsely populated areas, other effects include driving out hot humid summer air with drier air that may linger.[5] The only infrastructure damage that occurs as a direct result of a polar cyclone is to oil and gas rigs present throughout the Antarctic ocean (sometimes known as the Southern ocean). Some cargo and shipping vessels are also affected, although there are minimal or no reports of losses in recent years as the result of a polar low.
Forecasting
Polar lows are very difficult to forecast and a nowcasting approach is often used, with the systems being advected with the mid-tropospheric flow. Numerical weather prediction models are only just getting the horizontal and vertical resolution to represent these systems.
See also
References
- ↑ Rasmussen, E. A. & Turner, J. (2003), Polar Lows: Mesoscale Weather Systems in the Polar Regions, Cambridge: Cambridge University Press, p. 612, ISBN 0-521-62430-4.
- ↑ Erik A. Rasmussen and John Turner (2003). Polar lows: mesoscale weather systems in the polar regions. Cambridge University Press. p. 224. ISBN 978-0-521-62430-5. Retrieved 2011-01-27.
- ↑ http://www.maritime-executive.com/article/record-high-temperatures-record-low-arctic-sea-ice
- ↑ Halldór Björnsson. Global circulation. Veðurstofa Íslands. Retrieved on 2008-06-15.
- 1 2 https://www.wunderground.com/blog/JeffMasters/the-great-arctic-cyclone-of-2016-after-four-years-a-summer-sequel
External links
| Wikimedia Commons has media related to Polar lows. |
- European Polar Lows Working Group
- NSIDC
- Understanding Polar Lows - BBC Weather A-Z
- Polar Low Forecasting by MetEd