Air pollution

Air pollution is the introduction of particulates, biological molecules, and many harmful substances into Earth's atmosphere, causing diseases, allergies, death to humans, damage to other living organisms such as animals and food crops, or the natural or built environment. Air pollution may come from anthropogenic or natural sources.
The atmosphere is a complex natural gaseous system that is essential to support life on planet Earth.
Indoor air pollution and urban air quality are listed as two of the world's worst toxic pollution problems in the 2008 Blacksmith Institute World's Worst Polluted Places report.[1] According to the 2014 WHO report, air pollution in 2012 caused the deaths of around 7 million people worldwide,[2] an estimate roughly matched by the International Energy Agency.[3][4]
| Part of the nature series |
| Weather |
|---|
| Calendar seasons |
| Tropical seasons |
| Storms |
| Precipitation |
| Topics |
|
|
Pollutants

(NASA simulation; 9 November 2015)

An air pollutant is a substance in the air that can have adverse effects on humans and the ecosystem. The substance can be solid particles, liquid droplets, or gases. A pollutant can be of natural origin or man-made. Pollutants are classified as primary or secondary. Primary pollutants are usually produced from a process, such as ash from a volcanic eruption. Other examples include carbon monoxide gas from motor vehicle exhaust, or the sulfur dioxide released from factories. Secondary pollutants are not emitted directly. Rather, they form in the air when primary pollutants react or interact. Ground level ozone is a prominent example of a secondary pollutant. Some pollutants may be both primary and secondary: they are both emitted directly and formed from other primary pollutants.

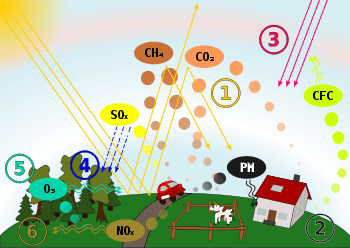

Major primary pollutants produced by human activity include:
- Sulfur oxides (SOx) - particularly sulfur dioxide, a chemical compound with the formula SO2. SO2 is produced by volcanoes and in various industrial processes. Coal and petroleum often contain sulfur compounds, and their combustion generates sulfur dioxide. Further oxidation of SO2, usually in the presence of a catalyst such as NO2, forms H2SO4, and thus acid rain.[2] This is one of the causes for concern over the environmental impact of the use of these fuels as power sources.
- Nitrogen oxides (NOx) - Nitrogen oxides, particularly nitrogen dioxide, are expelled from high temperature combustion, and are also produced during thunderstorms by electric discharge. They can be seen as a brown haze dome above or a plume downwind of cities. Nitrogen dioxide is a chemical compound with the formula NO2. It is one of several nitrogen oxides. One of the most prominent air pollutants, this reddish-brown toxic gas has a characteristic sharp, biting odor.
- Carbon monoxide (CO) - CO is a colorless, odorless, toxic yet non-irritating gas. It is a product by incomplete combustion of fuel such as natural gas, coal or wood. Vehicular exhaust is a major source of carbon monoxide.
- Volatile organic compounds (VOC) - VOCs are a well-known outdoor air pollutant. They are categorized as either methane (CH4) or non-methane (NMVOCs). Methane is an extremely efficient greenhouse gas which contributes to enhanced global warming. Other hydrocarbon VOCs are also significant greenhouse gases because of their role in creating ozone and prolonging the life of methane in the atmosphere. This effect varies depending on local air quality. The aromatic NMVOCs benzene, toluene and xylene are suspected carcinogens and may lead to leukemia with prolonged exposure. 1,3-butadiene is another dangerous compound often associated with industrial use.
- Particulates, alternatively referred to as particulate matter (PM), atmospheric particulate matter, or fine particles, are tiny particles of solid or liquid suspended in a gas. In contrast, aerosol refers to combined particles and gas. Some particulates occur naturally, originating from volcanoes, dust storms, forest and grassland fires, living vegetation, and sea spray. Human activities, such as the burning of fossil fuels in vehicles, power plants and various industrial processes also generate significant amounts of aerosols. Averaged worldwide, anthropogenic aerosols—those made by human activities—currently account for approximately 10 percent of our atmosphere. Increased levels of fine particles in the air are linked to health hazards such as heart disease,[8][9] altered lung function and lung cancer.
- Persistent free radicals connected to airborne fine particles are linked to cardiopulmonary disease.[10][11]
- Toxic metals, such as lead and mercury, especially their compounds.
- Chlorofluorocarbons (CFCs) - harmful to the ozone layer; emitted from products are currently banned from use. These are gases which are released from air conditioners, refrigerators, aerosol sprays, etc. CFC's on being released into the air rises to stratosphere. Here they come in contact with other gases and damage the ozone layer. This allows harmful ultraviolet rays to reach the earth's surface. This can lead to skin cancer, disease to eye and can even cause damage to plants.
- Ammonia (NH3) - emitted from agricultural processes. Ammonia is a compound with the formula NH3. It is normally encountered as a gas with a characteristic pungent odor. Ammonia contributes significantly to the nutritional needs of terrestrial organisms by serving as a precursor to foodstuffs and fertilizers. Ammonia, either directly or indirectly, is also a building block for the synthesis of many pharmaceuticals. Although in wide use, ammonia is both caustic and hazardous. In the atmosphere, ammonia reacts with oxides of nitrogen and sulfur to form secondary particles.[12]
- Odours — such as from garbage, sewage, and industrial processes
- Radioactive pollutants - produced by nuclear explosions, nuclear events, war explosives, and natural processes such as the radioactive decay of radon.
Secondary pollutants include:
- Particulates created from gaseous primary pollutants and compounds in photochemical smog. Smog is a kind of air pollution. Classic smog results from large amounts of coal burning in an area caused by a mixture of smoke and sulfur dioxide. Modern smog does not usually come from coal but from vehicular and industrial emissions that are acted on in the atmosphere by ultraviolet light from the sun to form secondary pollutants that also combine with the primary emissions to form photochemical smog.
- Ground level ozone (O3) formed from NOx and VOCs. Ozone (O3) is a key constituent of the troposphere. It is also an important constituent of certain regions of the stratosphere commonly known as the Ozone layer. Photochemical and chemical reactions involving it drive many of the chemical processes that occur in the atmosphere by day and by night. At abnormally high concentrations brought about by human activities (largely the combustion of fossil fuel), it is a pollutant, and a constituent of smog.
- Peroxyacetyl nitrate (PAN) - similarly formed from NOx and VOCs.
Minor air pollutants include:
- A large number of minor hazardous air pollutants. Some of these are regulated in USA under the Clean Air Act and in Europe under the Air Framework Directive
- A variety of persistent organic pollutants, which can attach to particulates
Persistent organic pollutants (POPs) are organic compounds that are resistant to environmental degradation through chemical, biological, and photolytic processes. Because of this, they have been observed to persist in the environment, to be capable of long-range transport, bioaccumulate in human and animal tissue, biomagnify in food chains, and to have potentially significant impacts on human health and the environment.
Sources

There are various locations, activities or factors which are responsible for releasing pollutants into the atmosphere. These sources can be classified into two major categories.
Anthropogenic (man-made) sources:

These are mostly related to the burning of multiple types of fuel.
- Stationary sources include smoke stacks of power plants, manufacturing facilities (factories) and waste incinerators, as well as furnaces and other types of fuel-burning heating devices. In developing and poor countries, traditional biomass burning is the major source of air pollutants; traditional biomass includes wood, crop waste and dung.[13][14]
- Mobile sources include motor vehicles, marine vessels, and aircraft.
- Controlled burn practices in agriculture and forest management. Controlled or prescribed burning is a technique sometimes used in forest management, farming, prairie restoration or greenhouse gas abatement. Fire is a natural part of both forest and grassland ecology and controlled fire can be a tool for foresters. Controlled burning stimulates the germination of some desirable forest trees, thus renewing the forest.
- Fumes from paint, hair spray, varnish, aerosol sprays and other solvents
- Waste deposition in landfills, which generate methane. Methane is highly flammable and may form explosive mixtures with air. Methane is also an asphyxiant and may displace oxygen in an enclosed space. Asphyxia or suffocation may result if the oxygen concentration is reduced to below 19.5% by displacement.
- Military resources, such as nuclear weapons, toxic gases, germ warfare and rocketry
Natural sources:

- Dust from natural sources, usually large areas of land with little or no vegetation
- Methane, emitted by the digestion of food by animals, for example cattle
- Radon gas from radioactive decay within the Earth's crust. Radon is a colorless, odorless, naturally occurring, radioactive noble gas that is formed from the decay of radium. It is considered to be a health hazard. Radon gas from natural sources can accumulate in buildings, especially in confined areas such as the basement and it is the second most frequent cause of lung cancer, after cigarette smoking.
- Smoke and carbon monoxide from wildfires
- Vegetation, in some regions, emits environmentally significant amounts of Volatile organic compounds (VOCs) on warmer days. These VOCs react with primary anthropogenic pollutants—specifically, NOx, SO2, and anthropogenic organic carbon compounds — to produce a seasonal haze of secondary pollutants.[15] Black gum, poplar, oak and willow are some examples of vegetation that can produce abundant VOCs. The VOC production from these species result in ozone levels up to eight times higher than the low-impact tree species.[16]
- Volcanic activity, which produces sulfur, chlorine, and ash particulates
Emission factors

Air pollutant emission factors are reported representative values that attempt to relate the quantity of a pollutant released to the ambient air with an activity associated with the release of that pollutant. These factors are usually expressed as the weight of pollutant divided by a unit weight, volume, distance, or duration of the activity emitting the pollutant (e.g., kilograms of particulate emitted per tonne of coal burned). Such factors facilitate estimation of emissions from various sources of air pollution. In most cases, these factors are simply averages of all available data of acceptable quality, and are generally assumed to be representative of long-term averages.
There are 12 compounds in the list of persistent organic pollutants. Dioxins and furans are two of them and intentionally created by combustion of organics, like open burning of plastics. These compounds are also endocrine disruptors and can mutate the human genes.
The United States Environmental Protection Agency has published a compilation of air pollutant emission factors for a wide range of industrial sources.[17] The United Kingdom, Australia, Canada and many other countries have published similar compilations, as well as the European Environment Agency.[18][19][20][21]
Exposure
Air pollution risk is a function of the hazard of the pollutant and the exposure to that pollutant. Air pollution exposure can be expressed for an individual, for certain groups (e.g. neighborhoods or children living in a country), or for entire populations. For example, one may want to calculate the exposure to a hazardous air pollutant for a geographic area, which includes the various microenvironments and age groups. This can be calculated[22] as an inhalation exposure. This would account for daily exposure in various settings (e.g. different indoor micro-environments and outdoor locations). The exposure needs to include different age and other demographic groups, especially infants, children, pregnant women and other sensitive subpopulations. The exposure to an air pollutant must integrate the concentrations of the air pollutant with respect to the time spent in each setting and the respective inhalation rates for each subgroup for each specific time that the subgroup is in the setting and engaged in particular activities (playing, cooking, reading, working, etc.). For example, a small child's inhalation rate will be less than that of an adult. A child engaged in vigorous exercise will have a higher respiration rate than the same child in a sedentary activity. The daily exposure, then, needs to reflect the time spent in each micro-environmental setting and the type of activities in these settings. The air pollutant concentration in each microactivity/microenvironmental setting is summed to indicate the exposure.[22]
Indoor air quality (IAQ)
A lack of ventilation indoors concentrates air pollution where people often spend the majority of their time. Radon (Rn) gas, a carcinogen, is exuded from the Earth in certain locations and trapped inside houses. Building materials including carpeting and plywood emit formaldehyde (H2CO) gas. Paint and solvents give off volatile organic compounds (VOCs) as they dry. Lead paint can degenerate into dust and be inhaled. Intentional air pollution is introduced with the use of air fresheners, incense, and other scented items. Controlled wood fires in stoves and fireplaces can add significant amounts of smoke particulates into the air, inside and out.[23] Indoor pollution fatalities may be caused by using pesticides and other chemical sprays indoors without proper ventilation.
Carbon monoxide poisoning and fatalities are often caused by faulty vents and chimneys, or by the burning of charcoal indoors or in a confined space, such as a tent.[24] Chronic carbon monoxide poisoning can result even from poorly-adjusted pilot lights. Traps are built into all domestic plumbing to keep sewer gas and hydrogen sulfide, out of interiors. Clothing emits tetrachloroethylene, or other dry cleaning fluids, for days after dry cleaning.
Though its use has now been banned in many countries, the extensive use of asbestos in industrial and domestic environments in the past has left a potentially very dangerous material in many localities. Asbestosis is a chronic inflammatory medical condition affecting the tissue of the lungs. It occurs after long-term, heavy exposure to asbestos from asbestos-containing materials in structures. Sufferers have severe dyspnea (shortness of breath) and are at an increased risk regarding several different types of lung cancer. As clear explanations are not always stressed in non-technical literature, care should be taken to distinguish between several forms of relevant diseases. According to the World Health Organisation (WHO), these may defined as; asbestosis, lung cancer, and Peritoneal Mesothelioma (generally a very rare form of cancer, when more widespread it is almost always associated with prolonged exposure to asbestos).
Biological sources of air pollution are also found indoors, as gases and airborne particulates. Pets produce dander, people produce dust from minute skin flakes and decomposed hair, dust mites in bedding, carpeting and furniture produce enzymes and micrometre-sized fecal droppings, inhabitants emit methane, mold forms on walls and generates mycotoxins and spores, air conditioning systems can incubate Legionnaires' disease and mold, and houseplants, soil and surrounding gardens can produce pollen, dust, and mold. Indoors, the lack of air circulation allows these airborne pollutants to accumulate more than they would otherwise occur in nature.
Health effects
Air pollution is a significant risk factor for a number of pollution-related diseases and health conditions including respiratory infections, heart disease, COPD, stroke and lung cancer.[2] The health effects caused by air pollution may include difficulty in breathing, wheezing, coughing, asthma and worsening of existing respiratory and cardiac conditions. These effects can result in increased medication use, increased doctor or emergency room visits, more hospital admissions and premature death. The human health effects of poor air quality are far reaching, but principally affect the body's respiratory system and the cardiovascular system. Individual reactions to air pollutants depend on the type of pollutant a person is exposed to, the degree of exposure, and the individual's health status and genetics.[22] The most common sources of air pollution include particulates, ozone, nitrogen dioxide, and sulphur dioxide. Children aged less than five years that live in developing countries are the most vulnerable population in terms of total deaths attributable to indoor and outdoor air pollution.[25]
Mortality
The World Health Organization estimated in 2014 that every year air pollution causes the premature death of some 7 million people worldwide.[2] India has the highest death rate due to air pollution.[26] India also has more deaths from asthma than any other nation according to the World Health Organization. In December 2013 air pollution was estimated to kill 500,000 people in China each year.[27] There is a positive correlation between pneumonia-related deaths and air pollution from motor vehicle emissions.[28]
Annual premature European deaths caused by air pollution are estimated at 430,000.[29] An important cause of these deaths is nitrogen dioxide and other nitrogen oxides (NOx) emitted by road vehicles.[29] Across the European Union, air pollution is estimated to reduce life expectancy by almost nine months.[30] Causes of deaths include strokes, heart disease, COPD, lung cancer, and lung infections.[2]
Urban outdoor air pollution is estimated to cause 1.3 million deaths worldwide per year. Children are particularly at risk due to the immaturity of their respiratory organ systems.[31]
The US EPA estimates that a proposed set of changes in diesel engine technology (Tier 2) could result in 12,000 fewer premature mortalities, 15,000 fewer heart attacks, 6,000 fewer emergency room visits by children with asthma, and 8,900 fewer respiratory-related hospital admissions each year in the United States.[32]
The US EPA has estimated that limiting ground-level ozone concentration to 65 parts per billion, would avert 1,700 to 5,100 premature deaths nationwide in 2020 compared with the 75-ppb standard. The agency projected the more protective standard would also prevent an additional 26,000 cases of aggravated asthma, and more than a million cases of missed work or school.[33][34] Following this assessment, the EPA acted to protect public health by lowering the National Ambient Air Quality Standards (NAAQS) for ground-level ozone to 70 parts per billion (ppb).[35]
A new economic study of the health impacts and associated costs of air pollution in the Los Angeles Basin and San Joaquin Valley of Southern California shows that more than 3,800 people die prematurely (approximately 14 years earlier than normal) each year because air pollution levels violate federal standards. The number of annual premature deaths is considerably higher than the fatalities related to auto collisions in the same area, which average fewer than 2,000 per year.[36][37][38]
Diesel exhaust (DE) is a major contributor to combustion-derived particulate matter air pollution. In several human experimental studies, using a well-validated exposure chamber setup, DE has been linked to acute vascular dysfunction and increased thrombus formation.[39][40]
The mechanisms linking air pollution to increased cardiovascular mortality are uncertain, but probably include pulmonary and systemic inflammation.[41]
Cardiovascular disease
A 2007 review of evidence found ambient air pollution exposure is a risk factor correlating with increased total mortality from cardiovascular events (range: 12% to 14% per 10 microg/m3 increase).[42]
Air pollution is also emerging as a risk factor for stroke, particularly in developing countries where pollutant levels are highest.[43] A 2007 study found that in women, air pollution is not associated with hemorrhagic but with ischemic stroke.[44] Air pollution was also found to be associated with increased incidence and mortality from coronary stroke in a cohort study in 2011.[45] Associations are believed to be causal and effects may be mediated by vasoconstriction, low-grade inflammation and atherosclerosis[46] Other mechanisms such as autonomic nervous system imbalance have also been suggested.[47] [48]
Lung disease
Chronic obstructive pulmonary disease (COPD) includes diseases such as chronic bronchitis and emphysema.[49]
Research has demonstrated increased risk of developing asthma[50] and COPD[51] from increased exposure to traffic-related air pollution. Additionally, air pollution has been associated with increased hospitalization and mortality from asthma and COPD.[52][53]
A study conducted in 1960-1961 in the wake of the Great Smog of 1952 compared 293 London residents with 477 residents of Gloucester, Peterborough, and Norwich, three towns with low reported death rates from chronic bronchitis. All subjects were male postal truck drivers aged 40 to 59. Compared to the subjects from the outlying towns, the London subjects exhibited more severe respiratory symptoms (including cough, phlegm, and dyspnea), reduced lung function (FEV1 and peak flow rate), and increased sputum production and purulence. The differences were more pronounced for subjects aged 50 to 59. The study controlled for age and smoking habits, so concluded that air pollution was the most likely cause of the observed differences.[54]
It is believed that much like cystic fibrosis, by living in a more urban environment serious health hazards become more apparent. Studies have shown that in urban areas patients suffer mucus hypersecretion, lower levels of lung function, and more self-diagnosis of chronic bronchitis and emphysema.[55]
Cancer
A review of evidence regarding whether ambient air pollution exposure is a risk factor for cancer in 2007 found solid data to conclude that long-term exposure to PM2.5 (fine particulates) increases the overall risk of non-accidental mortality by 6% per a 10 microg/m3 increase. Exposure to PM2.5 was also associated with an increased risk of mortality from lung cancer (range: 15% to 21% per 10 microg/m3 increase) and total cardiovascular mortality (range: 12% to 14% per a 10 microg/m3 increase). The review further noted that living close to busy traffic appears to be associated with elevated risks of these three outcomes --- increase in lung cancer deaths, cardiovascular deaths, and overall non-accidental deaths. The reviewers also found suggestive evidence that exposure to PM2.5 is positively associated with mortality from coronary heart diseases and exposure to SO2 increases mortality from lung cancer, but the data was insufficient to provide solid conclusions.[57] Another investigation showed that higher activity level increases deposition fraction of aerosol particles in human lung and recommended avoiding heavy activities like running in outdoor space at polluted areas.[58]
In 2011, a large Danish epidemiological study found an increased risk of lung cancer for patients who lived in areas with high nitrogen oxide concentrations. In this study, the association was higher for non-smokers than smokers.[59] An additional Danish study, also in 2011, likewise noted evidence of possible associations between air pollution and other forms of cancer, including cervical cancer and brain cancer.[60]
In December 2015, medical scientists reported that cancer is overwhelmingly a result of environmental factors, and not largely down to bad luck.[56] Maintaining a healthy weight, eating a healthy diet, minimizing alcohol and eliminating smoking reduces the risk of developing the disease, according to the researchers.[56]
Children
In the United States, despite the passage of the Clean Air Act in 1970, in 2002 at least 146 million Americans were living in non-attainment areas—regions in which the concentration of certain air pollutants exceeded federal standards.[61] These dangerous pollutants are known as the criteria pollutants, and include ozone, particulate matter, sulfur dioxide, nitrogen dioxide, carbon monoxide, and lead. Protective measures to ensure children's health are being taken in cities such as New Delhi, India where buses now use compressed natural gas to help eliminate the "pea-soup" smog.[62] A recent study in Europe has found that exposure to ultrafine particles can increase blood pressure in children.[63]
"Clean" areas
Even in the areas with relatively low levels of air pollution, public health effects can be significant and costly, since a large number of people breathe in such pollutants. A 2005 scientific study for the British Columbia Lung Association showed that a small improvement in air quality (1% reduction of ambient PM2.5 and ozone concentrations) would produce $29 million in annual savings in the Metro Vancouver region in 2010.[64] This finding is based on health valuation of lethal (death) and sub-lethal (illness) affects.
Central nervous system
Data is accumulating that air pollution exposure also affects the central nervous system.[65]
In a June 2014 study conducted by researchers at the University of Rochester Medical Center, published in the journal Environmental Health Perspectives, it was discovered that early exposure to air pollution causes the same damaging changes in the brain as autism and schizophrenia. The study also shows that air pollution also affected short-term memory, learning ability, and impulsivity. Lead researcher Professor Deborah Cory-Slechta said that "When we looked closely at the ventricles, we could see that the white matter that normally surrounds them hadn't fully developed. It appears that inflammation had damaged those brain cells and prevented that region of the brain from developing, and the ventricles simply expanded to fill the space. Our findings add to the growing body of evidence that air pollution may play a role in autism, as well as in other neurodevelopmental disorders." Air pollution has a more significant negative effect on males than on females.[66][67][68]
In 2015, experimental studies reported the detection of significant episodic (situational) cognitive impairment from impurities in indoor air breathed by test subjects who were not informed about changes in the air quality. Researchers at the Harvard University and SUNY Upstate Medical University and Syracuse University measured the cognitive performance of 24 participants in three different controlled laboratory atmospheres that simulated those found in "conventional" and "green" buildings, as well as green buildings with enhanced ventilation. Performance was evaluated objectively using the widely used Strategic Management Simulation software simulation tool, which is a well-validated assessment test for executive decision-making in an unconstrained situation allowing initiative and improvisation. Significant deficits were observed in the performance scores achieved in increasing concentrations of either volatile organic compounds (VOCs) or carbon dioxide, while keeping other factors constant. The highest impurity levels reached are not uncommon in some classroom or office environments.[69][70]
Agricultural effects
In India in 2014, it was reported that air pollution by black carbon and ground level ozone had cut crop yields in the most affected areas by almost half in 2010 when compared to 1980 levels.[71]
Economic effects
Air pollution costs the world economy $5 trillion per year as a result of productivity losses and degraded quality of life, according to a joint study by the World Bank and the Institute for Health Metrics and Evaluation (IHME) at the University of Washington[72][73] These productivity losses are caused by deaths due to diseases caused by air pollution. One out of ten deaths in 2013 was caused by diseases associated with air pollution and the problem is getting worse. The problem is even more acute in the developing world. "Children under age 5 in lower-income countries are more than 60 times as likely to die from exposure to air pollution as children in high-income countries."[72][73] The report states that additional economic losses caused by air pollution, including health costs and the adverse effect on agricultural and other productivity were not calculated in the report, and thus the actual costs to the world economy are far higher than $5 trillion.
Historical disasters
The world's worst short-term civilian pollution crisis was the 1984 Bhopal Disaster in India.[74] Leaked industrial vapours from the Union Carbide factory, belonging to Union Carbide, Inc., U.S.A. (later bought by Dow Chemical Company), killed at least 3787 people and injured anywhere from 150,000 to 600,000. The United Kingdom suffered its worst air pollution event when the December 4 Great Smog of 1952 formed over London. In six days more than 4,000 died and more recent estimates put the figure at nearer 12,000.[75] An accidental leak of anthrax spores from a biological warfare laboratory in the former USSR in 1979 near Sverdlovsk is believed to have caused at least 64 deaths.[76] The worst single incident of air pollution to occur in the US occurred in Donora, Pennsylvania in late October, 1948, when 20 people died and over 7,000 were injured.[77]
Alternatives to pollution
There are now practical alternatives to the three principal causes of air pollution.
- Combustion of fossil fuels for space heating can be replaced by using ground source heat pumps and seasonal thermal energy storage.[78]
- Electric power generation from burning fossil fuels can be replaced by power generation from nuclear and renewables.
- Motor vehicles driven by fossil fuels, a key factor in urban air pollution, can be replaced by electric vehicles.
Reduction efforts
There are various air pollution control technologies and strategies available to reduce air pollution.[79][80] At its most basic level, land-use planning is likely to involve zoning and transport infrastructure planning. In most developed countries, land-use planning is an important part of social policy, ensuring that land is used efficiently for the benefit of the wider economy and population, as well as to protect the environment.
Because a large share of air pollution is caused by combustion of fossil fuels such as coal and oil, the reduction of these fuels can reduce air pollution drastically. Most effective is the switch to clean power sources such as wind power, solar power, hydro power which don't cause air pollution.[81] Efforts to reduce pollution from mobile sources includes primary regulation (many developing countries have permissive regulations), expanding regulation to new sources (such as cruise and transport ships, farm equipment, and small gas-powered equipment such as string trimmers, chainsaws, and snowmobiles), increased fuel efficiency (such as through the use of hybrid vehicles), conversion to cleaner fuels or conversion to electric vehicles.
Titanium dioxide has been researched for its ability to reduce air pollution. Ultraviolet light will release free electrons from material, thereby creating free radicals, which break up VOCs and NOx gases. One form is superhydrophilic.[82]
In 2014, Prof. Tony Ryan and Prof. Simon Armitage of University of Sheffield prepared a 10 meter by 20 meter-sized poster coated with microscopic, pollution-eating nanoparticles of titanium dioxide. Placed on a building, this giant poster can absorb the toxic emission from around 20 cars each day.[83]
A very effective means to reduce air pollution is the transition to renewable energy. According to a study published in Energy and Environmental Science in 2015 the switch to 100% renewable energy in the United States would eliminate about 62,000 premature mortalities per year and about 42,000 in 2050, if no biomass were used. This would save about $600 billion in health costs a year due to reduced air pollution in 2050, or about 3.6% of the 2014 U.S. gross domestic product.[81]
Control devices
The following items are commonly used as pollution control devices in industry and transportation. They can either destroy contaminants or remove them from an exhaust stream before it is emitted into the atmosphere.
- Particulate control
- Mechanical collectors (dust cyclones, multicyclones)
- Electrostatic precipitators An electrostatic precipitator (ESP), or electrostatic air cleaner is a particulate collection device that removes particles from a flowing gas (such as air), using the force of an induced electrostatic charge. Electrostatic precipitators are highly efficient filtration devices that minimally impede the flow of gases through the device, and can easily remove fine particulates such as dust and smoke from the air stream.
- Baghouses Designed to handle heavy dust loads, a dust collector consists of a blower, dust filter, a filter-cleaning system, and a dust receptacle or dust removal system (distinguished from air cleaners which utilize disposable filters to remove the dust).
- Particulate scrubbers Wet scrubber is a form of pollution control technology. The term describes a variety of devices that use pollutants from a furnace flue gas or from other gas streams. In a wet scrubber, the polluted gas stream is brought into contact with the scrubbing liquid, by spraying it with the liquid, by forcing it through a pool of liquid, or by some other contact method, so as to remove the pollutants.
- Scrubbers
- NOx control
- Low NOx burners
- Selective catalytic reduction (SCR)
- Selective non-catalytic reduction (SNCR)
- NOx scrubbers
- Exhaust gas recirculation
- Catalytic converter (also for VOC control)
- VOC abatement
- Acid Gas/SO2 control
- Mercury control
- Sorbent Injection Technology
- Electro-Catalytic Oxidation (ECO)
- K-Fuel
- Dioxin and furan control
- Miscellaneous associated equipment
- Source capturing systems
- Continuous emissions monitoring systems (CEMS)
Regulations

In general, there are two types of air quality standards. The first class of standards (such as the U.S. National Ambient Air Quality Standards and E.U. Air Quality Directive) set maximum atmospheric concentrations for specific pollutants. Environmental agencies enact regulations which are intended to result in attainment of these target levels. The second class (such as the North American Air Quality Index) take the form of a scale with various thresholds, which is used to communicate to the public the relative risk of outdoor activity. The scale may or may not distinguish between different pollutants.
Canada
In Canada, air pollution and associated health risks are measured with the Air Quality Health Index or (AQHI). It is a health protection tool used to make decisions to reduce short-term exposure to air pollution by adjusting activity levels during increased levels of air pollution.
The Air Quality Health Index or "AQHI" is a federal program jointly coordinated by Health Canada and Environment Canada. However, the AQHI program would not be possible without the commitment and support of the provinces, municipalities and NGOs. From air quality monitoring to health risk communication and community engagement, local partners are responsible for the vast majority of work related to AQHI implementation. The AQHI provides a number from 1 to 10+ to indicate the level of health risk associated with local air quality. Occasionally, when the amount of air pollution is abnormally high, the number may exceed 10. The AQHI provides a local air quality current value as well as a local air quality maximums forecast for today, tonight and tomorrow and provides associated health advice.
| 1 | 2 | 3 | 4 | 5 | 6 | 7 | 8 | 9 | 10 | + |
| Risk: | Low (1-3) | Moderate (4-6) | High (7-10) | Very high (above 10) |
As it is now known that even low levels of air pollution can trigger discomfort for the sensitive population, the index has been developed as a continuum: The higher the number, the greater the health risk and need to take precautions. The index describes the level of health risk associated with this number as 'low', 'moderate', 'high' or 'very high', and suggests steps that can be taken to reduce exposure.[84]
| Health Risk | Air Quality Health Index | Health Messages[85] | |
|---|---|---|---|
| At Risk population | General Population | ||
| Low | 1-3 | Enjoy your usual outdoor activities. | Ideal air quality for outdoor activities |
| Moderate | 4-6 | Consider reducing or rescheduling strenuous activities outdoors if you are experiencing symptoms. | No need to modify your usual outdoor activities unless you experience symptoms such as coughing and throat irritation. |
| High | 7-10 | Reduce or reschedule strenuous activities outdoors. Children and the elderly should also take it easy. | Consider reducing or rescheduling strenuous activities outdoors if you experience symptoms such as coughing and throat irritation. |
| Very high | Above 10 | Avoid strenuous activities outdoors. Children and the elderly should also avoid outdoor physical exertion and should stay indoors. | Reduce or reschedule strenuous activities outdoors, especially if you experience symptoms such as coughing and throat irritation. |
The measurement is based on the observed relationship of Nitrogen Dioxide (NO2), ground-level Ozone (O3) and particulates (PM2.5) with mortality, from an analysis of several Canadian cities. Significantly, all three of these pollutants can pose health risks, even at low levels of exposure, especially among those with pre-existing health problems.
When developing the AQHI, Health Canada's original analysis of health effects included five major air pollutants: particulates, ozone, and nitrogen dioxide (NO2), as well as sulfur dioxide (SO2), and carbon monoxide (CO). The latter two pollutants provided little information in predicting health effects and were removed from the AQHI formulation.
The AQHI does not measure the effects of odour, pollen, dust, heat or humidity.
Germany
TA Luft is the German air quality regulation.
Hotspots
Air pollution hotspots are areas where air pollution emissions expose individuals to increased negative health effects.[86] They are particularly common in highly populated, urban areas, where there may be a combination of stationary sources (e.g. industrial facilities) and mobile sources (e.g. cars and trucks) of pollution. Emissions from these sources can cause respiratory disease, childhood asthma, cancer, and other health problems. Fine particulate matter such as diesel soot, which contributes to more than 3.2 million premature deaths around the world each year, is a significant problem. It is very small and can lodge itself within the lungs and enter the bloodstream. Diesel soot is concentrated in densely populated areas, and one in six people in the U.S. live near a diesel pollution hot spot.[87]
While air pollution hotspots affect a variety of populations, some groups are more likely to be located in hotspots. Previous studies have shown disparities in exposure to pollution by race and/or income. Hazardous land uses (toxic storage and disposal facilities, manufacturing facilities, major roadways) tend to be located where property values and income levels are low. Low socioeconomic status can be a proxy for other kinds of social vulnerability, including race, a lack of ability to influence regulation and a lack of ability to move to neighborhoods with less environmental pollution. These communities bear a disproportionate burden of environmental pollution and are more likely to face health risks such as cancer or asthma.[88]
Studies show that patterns in race and income disparities not only indicate a higher exposure to pollution but also higher risk of adverse health outcomes.[89] Communities characterized by low socioeconomic status and racial minorities can be more vulnerable to cumulative adverse health impacts resulting from elevated exposure to pollutants than more privileged communities.[89] Blacks and Latinos generally face more pollution than whites and Asians, and low-income communities bear a higher burden of risk than affluent ones.[88] Racial discrepancies are particularly distinct in suburban areas of the US South and metropolitan areas of the US West.[90] Residents in public housing, who are generally low-income and cannot move to healthier neighborhoods, are highly affected by nearby refineries and chemical plants.[91]
Cities


Air pollution is usually concentrated in densely populated metropolitan areas, especially in developing countries where environmental regulations are relatively lax or nonexistent.[92] However, even populated areas in developed countries attain unhealthy levels of pollution, with Los Angeles and Rome being two examples.[93] Between 2002 and 2011 the incidence of lung cancer in Beijing near doubled. While smoking remains the leading cause of lung cancer in China, the number of smokers is falling while lung cancer rates are rising.[94] Another project focusing on the effects on pollution in vegetation has been researched by the local university in Sheffield, UK.
National-scale air toxics assessments 1995-2005
The national-scale air toxics assessment(NATA) is an evaluation of air toxics by the U.S. EPA. EPA has furnished four assessments that characterize nationwide chronic cancer risk estimates and noncancer hazards from inhaling air toxics. The lates was from 2005, and made publicly available in early 2011.
"EPA developed the NATA as a state-of-the-science screening tool for State/Local/Tribal Agencies to prioritize pollutants, emission sources and locations of interest for further study, in order to gain a better understanding of the risks. NATA assessments do not incorporate refined information about emission sources, but rather, use general information about sources to develop estimates of risks which are more likely to overestimate impacts than underestimate them. NATA provides estimates of the risk of cancer and other serious health effects from breathing (inhaling) air toxics in order to inform both national and more localized efforts to identify and prioritize air toxics, emission source types and locations which are of greatest potential concern in terms of contributing to population risk. This in turn helps air pollution experts focus limited analytical resources on areas and or populations where the potential for health risks are highest. Assessments include estimates of cancer and non-cancer health effects based on chronic exposure from outdoor sources, including assessments of non-cancer health effects for Diesel Particulate Matter. Assessments provide a snapshot of the outdoor air quality and the risks to human health that would result if air toxic emissions levels remained unchanged."[95]
| Most polluted cities by PM[96] | |
|---|---|
| Particulate matter, μg/m³ (2004) |
City |
| 168 | Cairo, Egypt |
| 150 | Delhi, India |
| 128 | Kolkata, India (Calcutta) |
| 125 | Tianjin, China |
| 123 | Chongqing, China |
| 109 | Kanpur, India |
| 109 | Lucknow, India |
| 104 | Jakarta, Indonesia |
| 101 | Shenyang, China |
Governing urban air pollution
In Europe, Council Directive 96/62/EC on ambient air quality assessment and management provides a common strategy against which member states can "set objectives for ambient air quality in order to avoid, prevent or reduce harmful effects on human health and the environment . . . and improve air quality where it is unsatisfactory".[97]
On 25 July 2008 in the case Dieter Janecek v Freistaat Bayern CURIA, the European Court of Justice ruled that under this directive[97] citizens have the right to require national authorities to implement a short term action plan that aims to maintain or achieve compliance to air quality limit values.[98]
This important case law appears to confirm the role of the EC as centralised regulator to European nation-states as regards air pollution control. It places a supranational legal obligation on the UK to protect its citizens from dangerous levels of air pollution, furthermore superseding national interests with those of the citizen.
In 2010, the European Commission (EC) threatened the UK with legal action against the successive breaching of PM10 limit values.[99] The UK government has identified that if fines are imposed, they could cost the nation upwards of £300 million per year.[100]
In March 2011, the Greater London Built-up Area remains the only UK region in breach of the EC's limit values, and has been given 3 months to implement an emergency action plan aimed at meeting the EU Air Quality Directive.[101] The City of London has dangerous levels of PM10 concentrations, estimated to cause 3000 deaths per year within the city.[102] As well as the threat of EU fines, in 2010 it was threatened with legal action for scrapping the western congestion charge zone, which is claimed to have led to an increase in air pollution levels.[103]
In response to these charges, Boris Johnson, Mayor of London, has criticised the current need for European cities to communicate with Europe through their nation state's central government, arguing that in future "A great city like London" should be permitted to bypass its government and deal directly with the European Commission regarding its air quality action plan.[101]
This can be interpreted as recognition that cities can transcend the traditional national government organisational hierarchy and develop solutions to air pollution using global governance networks, for example through transnational relations. Transnational relations include but are not exclusive to national governments and intergovernmental organisations,[104] allowing sub-national actors including cities and regions to partake in air pollution control as independent actors.
Particularly promising at present are global city partnerships.[105] These can be built into networks, for example the C40 Cities Climate Leadership Group, of which London is a member. The C40 is a public 'non-state' network of the world's leading cities that aims to curb their greenhouse emissions.[105] The C40 has been identified as 'governance from the middle' and is an alternative to intergovernmental policy.[106] It has the potential to improve urban air quality as participating cities "exchange information, learn from best practices and consequently mitigate carbon dioxide emissions independently from national government decisions".[105] A criticism of the C40 network is that its exclusive nature limits influence to participating cities and risks drawing resources away from less powerful city and regional actors.
Atmospheric dispersion
The basic technology for analyzing air pollution is through the use of a variety of mathematical models for predicting the transport of air pollutants in the lower atmosphere. The principal methodologies are:
- Point source dispersion, used for industrial sources
- Line source dispersion, used for airport and roadway air dispersion modeling
- Area source dispersion, used for forest fires or duststorms
- Photochemical models, used to analyze reactive pollutants that form smog

The point source problem is the best understood, since it involves simpler mathematics and has been studied for a long period of time, dating back to about the year 1900. It uses a Gaussian dispersion model for continuous buoyant pollution plumes to predict the air pollution isopleths, with consideration given to wind velocity, stack height, emission rate and stability class (a measure of atmospheric turbulence).[107][108] This model has been extensively validated and calibrated with experimental data for all sorts of atmospheric conditions.
The roadway air dispersion model was developed starting in the late 1950s and early 1960s in response to requirements of the National Environmental Policy Act and the U.S. Department of Transportation (then known as the Federal Highway Administration) to understand impacts of proposed new highways upon air quality, especially in urban areas. Several research groups were active in this model development, among which were: the Environmental Research and Technology (ERT) group in Lexington, Massachusetts, the ESL Inc. group in Sunnyvale, California and the California Air Resources Board group in Sacramento, California. The research of the ESL group received a boost with a contract award from the United States Environmental Protection Agency to validate a line source model using sulfur hexafluoride as a tracer gas. This program was successful in validating the line source model developed by ESL Inc. Some of the earliest uses of the model were in court cases involving highway air pollution; the Arlington, Virginia portion of Interstate 66 and the New Jersey Turnpike widening project through East Brunswick, New Jersey.
Area source models were developed in 1971 through 1974 by the ERT and ESL groups, but addressed a smaller fraction of total air pollution emissions, so that their use and need was not as widespread as the line source model, which enjoyed hundreds of different applications as early as the 1970s. Similarly photochemical models were developed primarily in the 1960s and 70s, but their use was more specialized and for regional needs, such as understanding smog formation in Los Angeles, California.
See also
References
- ↑ "Reports". WorstPolluted.org. Archived from the original on 11 August 2010. Retrieved 2010-08-29.
- 1 2 3 4 "7 million premature deaths annually linked to air pollution". WHO. 25 March 2014. Retrieved 25 March 2014.
- ↑ http://www.iea.org/publications/freepublications/publication/WorldEnergyOutlookSpecialReport2016EnergyandAirPollution.pdf
- ↑ "Study Links 6.5 Million Deaths Each Year to Air Pollution". New York Times. 26 June 2016. Retrieved 27 June 2016.
- ↑ St. Fleur, Nicholas (10 November 2015). "Atmospheric Greenhouse Gas Levels Hit Record, Report Says". New York Times. Retrieved 11 November 2015.
- ↑ Ritter, Karl (9 November 2015). "UK: In 1st, global temps average could be 1 degree C higher". AP News. Retrieved 11 November 2015.
- ↑ Cole, Steve; Gray, Ellen (14 December 2015). "New NASA Satellite Maps Show Human Fingerprint on Global Air Quality". NASA. Retrieved 14 December 2015.
- ↑ "Evidence growing of air pollution's link to heart disease, death". Archived from the original on 2010-06-03. Retrieved 2010-05-18. // American Heart Association. May 10, 2010
- ↑ Pope, CA; Aruni Bhatnagar; James P. McCracken; Wesley T. Abplanalp; Daniel J. Conklin; Timothy E. O'Toole (2016). "Exposure to Fine Particulate Air Pollution Is Associated with Endothelial Injury and Systemic Inflammation". Circulation Research. doi:10.1161/circresaha.116.309279.
- ↑ "Newly detected air pollutant mimics damaging effects of cigarette smoke" (PDF). Retrieved 2010-08-29.
- ↑ "Infant Inhalation Of Ultra-fine Air Pollution Linked To Adult Lung Disease". Sciencedaily.com. 2009-07-23. Retrieved 2010-08-29.
- ↑ "The Effect of Changing Background Emissions on External Cost Estimates for Secondary Particulates" (PDF). Open environmental sciences. 2008.
- ↑ David Pennise; Kirk Smith. "Biomass Pollution Basics" (PDF). WHO.
- ↑ "Indoor air pollution and household energy". WHO and UNEP. 2011.
- ↑ Goldstein, Allen H.; Charles D. Koven; Colette L. Heald; Inez Y. Fung (2009-05-05). "Biogenic carbon and anthropogenic pollutants combine to form a cooling haze over the southeastern United States". Proceedings of the National Academy of Sciences. Retrieved 2010-12-05.
- ↑ Scientific American, June 2014, p. 14
- ↑ "AP 42, Volume I". Epa.gov. Archived from the original on 24 September 2010. Retrieved 2010-08-29.
- ↑ "United Kingdom's emission factor database". Naei.org.uk. Retrieved 2010-08-29.
- ↑ "EMEP/EEA air pollutant emission inventory guidebook — 2009". Eea.europa.eu. 2009-06-19. Retrieved 2012-12-11.
- ↑ "Environmental Pollution". Theenvironmentalblog.org. 2011-12-16. Retrieved 2012-12-11.
- ↑ "Revised 1996 IPCC Guidelines for National Greenhouse Gas Inventories (reference manual)". Ipcc-nggip.iges.or.jp. Retrieved 2010-08-29.
- 1 2 3 Daniel A. Vallero. "Fundamentals of Air Pollution". Elsevier Academic Press.
- ↑ "Duflo, E., Greenstone, M., and Hanna, R. (2008) "Indoor air pollution, health and economic well-being". ''S.A.P.I.EN.S.'' '''1''' (1)". Sapiens.revues.org. Retrieved 2010-08-29.
- ↑ "Bucknell tent death: Hannah Thomas-Jones died from carbon monoxide poisoning". BBC News. 17 January 2013. Retrieved 22 September 2015.
- ↑ "Air quality and health". www.who.int. Retrieved 2011-11-26.
- ↑ The New York Times International Weekly 2nd February 2014 'Beijing's Air Would Be Called Good In Delhi' by Gardiner Harris.
- ↑ Mr Chen's claim was made in The Lancet (December 2013 issue) and reported in The Daily Telegraph 8th January 2014 page 15 'Air pollution killing up to 500,000 Chinese each year, admits former health minister.
- ↑ "Study links traffic pollution to thousands of deaths". The Guardian. London, UK: Guardian Media Group. 2008-04-15. Archived from the original on 20 April 2008. Retrieved 2008-04-15.
- 1 2 Car emissions: taking tests out of the lab and onto the road by EMIS (Committee of Inquiry into Emission Measurements in the Automotive Sector).
- ↑ "Air pollution causes early deaths". BBC. February 21, 2005. Retrieved August 14, 2012.
- ↑ "Air pollution". World Health Organization. Retrieved 2016-12-02.
- ↑ "Clean Air Nonroad Diesel Rule" (PDF). EPA. May 2004. p. 5. Retrieved 28 April 2015.
- ↑ Tankersley, Jim (January 8, 2010). "EPA proposes nation's strictest smog limits ever". Los Angeles Times. Retrieved August 14, 2012.
- ↑ "EPA slideshow" (PDF). Retrieved 2012-12-11.
- ↑ EPA Strengthens Ozone Standards to Protect Public Health/Science-based standards to reduce sick days, asthma attacks, emergency room visits, greatly outweigh costs (10/1/2015)
- ↑ Grossni, Mark (November 13, 2008). "Human cost of valley's dirty air: $6.3 billion". Sacramento Bee. Archived from the original on 2008-12-16. Retrieved August 14, 2012.
- ↑ Sahagun, Louis (November 13, 2008). "Pollution saps state's economy, study says". Los Angeles Times. Retrieved August 14, 2012.
- ↑ Kay, Jane (November 13, 2008). "Bad air costing state's economy billions". San Francisco Chronicle. Retrieved August 14, 2012.
- ↑ Lucking, A. J.; Lundback, M.; Mills, N. L.; Faratian, D.; Barath, S. L.; Pourazar, J.; Cassee, F. R.; Donaldson, K.; Boon, N. A.; Badimon, J. J.; Sandstrom, T.; Blomberg, A.; Newby, D. E. (2008). "Diesel exhaust inhalation increases thrombus formation in man". European Heart Journal. 29 (24): 3043–3051. doi:10.1093/eurheartj/ehn464. PMID 18952612.
- ↑ Törnqvist, H. K.; Mills, N. L.; Gonzalez, M.; Miller, M. R.; Robinson, S. D.; Megson, I. L.; MacNee, W.; Donaldson, K.; Söderberg, S.; Newby, D. E.; Sandström, T.; Blomberg, A. (2007). "Persistent Endothelial Dysfunction in Humans after Diesel Exhaust Inhalation". American Journal of Respiratory and Critical Care Medicine. 176 (4): 395–400. doi:10.1164/rccm.200606-872OC. PMID 17446340.
- ↑ Pope, C. A. (15 December 2003). "Cardiovascular Mortality and Long-Term Exposure to Particulate Air Pollution: Epidemiological Evidence of General Pathophysiological Pathways of Disease". Circulation. 109 (1): 71–77. doi:10.1161/01.CIR.0000108927.80044.7F.
- ↑ Chen, H; Goldberg, MS; Villeneuve, PJ (Oct–Dec 2008). "A systematic review of the relation between long-term exposure to ambient air pollution and chronic diseases.". Reviews on environmental health. 23 (4): 243–97. doi:10.1515/reveh.2008.23.4.243. PMID 19235364.
- ↑ Mateen, F. J.; Brook, R. D. (2011). "Air Pollution as an Emerging Global Risk Factor for Stroke". JAMA. 305 (12): 1240–1241. doi:10.1001/jama.2011.352. PMID 21427378.
- ↑ Miller K. A.; Siscovick D. S.; Sheppard L.; Shepherd K.; Sullivan J. H.; Anderson G. L.; Kaufman J. D. (2007). "Long-term exposure to air pollution and incidence of cardiovascular events in women.". The New England Journal of Medicine. Research Support, N.I.H., ExtramuralResearch Support, U.S. Gov't, Non-P.H.S. 356 (5): 447–458. doi:10.1056/NEJMoa054409. PMID 17267905.
- ↑ Andersen, Z. J., Kristiansen, L. C., Andersen, K. K., Olsen, T. S., Hvidberg, M., Jensen, S. S., Raaschou-Nielsen, O. (2011). Stroke and Long-Term Exposure to Outdoor Air Pollution From Nitrogen Dioxide: A Cohort Study. Stroke; a journal of cerebral circulation. doi:10.1161/STROKEAHA.111.629246 PMID 22052517
- ↑ Provost, E; Madhloum, N; Int Panis, L; De Boever, P; Nawrot, TS (May 2015). "Carotid intima-media thickness, a marker of subclinical atherosclerosis, and particulate air pollution exposure: the meta-analytical evidence". PLoS ONE. 10 (5): e0127014. doi:10.1371/journal.pone.0127014. PMID 25970426.
- ↑ Brook, RD; Rajagopalan, S; Pope, CA III; Brook, JR; Bhatnagar, A (2010). "Particulate matter air pollution and cardiovascular disease: An update to the scientific statement from the American Heart Association". Circulation. 121: 2331–2378. doi:10.1161/cir.0b013e3181dbece1.
- ↑ Louwies, T; Int Panis, L; Kicinski, M; De Boever, P; Nawrot, Tim S (2013). "Retinal Microvascular Responses to Short-Term Changes in Particulate Air Pollution in Healthy Adults". Environmental Health Perspectives. doi:10.1289/ehp.1205721.
- ↑ Zoidis, John D. (1999). "The Impact of Air Pollution on COPD". RT: for Decision Makers in Respiratory Care.
- ↑ Gehring, U., Wijga, A. H., Brauer, M., Fischer, P., de Jongste, J. C., Kerkhof, M., Brunekreef, B. (2010). Traffic-related air pollution and the development of asthma and allergies during the first 8 years of life. [Research Support, Non-U.S. Gov't]. American journal of respiratory and critical care medicine, 181(6), 596-603. doi:10.1164/rccm.200906-0858OC
- ↑ Andersen, Z. J., Hvidberg, M., Jensen, S. S., Ketzel, M., Loft, S., Sorensen, M., Raaschou-Nielsen, O. (2011). Chronic obstructive pulmonary disease and long-term exposure to traffic-related air pollution: a cohort study. [Research Support, Non-U.S. Gov't]. American journal of respiratory and critical care medicine, 183(4), 455-461. doi:10.1164/rccm.201006-0937OC
- ↑ Health effects of outdoor air pollution. Committee of the Environmental and Occupational Health Assembly of the American Thoracic Society. (1996). [Comparative Study Review]. American journal of respiratory and critical care medicine, 153(1), 3-50.
- ↑ Andersen, Z. J., Bonnelykke, K., Hvidberg, M., Jensen, S. S., Ketzel, M., Loft, S., Raaschou-Nielsen, O. (2011). Long-term exposure to air pollution and asthma hospitalisations in older adults: a cohort study. Thorax. doi:10.1136/thoraxjnl-2011-200711
- ↑ Holland WW, Reid DD. The urban factor in chronic bronchitis" Lancet 1965;I:445-448.
- ↑ J. Sunyer (2001). "Urban air pollution and Chronic Obstructive Pulmonary disease: a review". European Respiratory Journal. 17 (5): 1024–1033. doi:10.1183/09031936.01.17510240. PMID 11488305.
- 1 2 3 Gallagher, James (17 December 2015). "Cancer is not just 'bad luck' but down to environment, study suggests". BBC. Retrieved 17 December 2015.
- ↑ Chen, H; Goldberg, M. S.; Villeneuve, P. J. (2008). "A systematic review of the relation between long-term exposure to ambient air pollution and chronic diseases". Reviews on environmental health. 23 (4): 243–97. doi:10.1515/reveh.2008.23.4.243. PMID 19235364.
- ↑ Saber, E.M.; Heydari, G. (May 2012). "Flow patterns and deposition fraction of particles in the range of 0.1–10 μm at trachea and the first third generations under different breathing conditions". Computers in Biology and Medicine. 42 (5): 631–638. doi:10.1016/j.compbiomed.2012.03.002. PMID 22445097.
- ↑ Raaschou-Nielsen, O., Andersen, Z. J., Hvidberg, M., Jensen, S. S., Ketzel, M., Sorensen, M., Tjonneland, A. (2011). Lung cancer incidence and long-term exposure to air pollution from traffic. [Research Support, Non-U.S. Gov't]. Environmental health perspectives, 119(6), 860-865. doi:10.1289/ehp.1002353 PMID 21227886
- ↑ Raaschou-Nielsen, O., Andersen, Z. J., Hvidberg, M., Jensen, S. S., Ketzel, M., Sorensen, M., Tjonneland, A. (2011). Air pollution from traffic and cancer incidence: a Danish cohort study. [Research Support, Non-U.S. Gov't]. Environmental health : a global access science source, 10, 67. doi:10.1186/1476-069X-10-67 PMID 21771295
- ↑ Committee on Environmental Health (2004). "Ambient Air Pollution: Health Hazards to Children". Pediatrics. 114 (6): 1699–1707. doi:10.1542/peds.2004-2166. PMID 15574638.
- ↑ "Polluted Cities: The Air Children Breathe" (PDF). World Health Organization.
- ↑ Pieters, N; Koppen, G; Van Poppel, M; De Prins, S; Cox, B; Dons, E; Nelen, V; Int Panis, L; Plusquin, M; Schoeters, G; Nawrot, TS (March 2015). "Blood Pressure and Same-Day Exposure to Air Pollution at School: Associations with Nano-Sized to Coarse PM in Children.". Environmental Health Perspectives. 123: 737–42. doi:10.1289/ehp.1408121. PMID 25756964.
- ↑ "2005 BC Lung Association report on the valuation of health impacts from air quality in the Lower Fraser Valley airshed" (PDF). Retrieved 2010-08-29.
- ↑ Bos, I; De Boever, P; Int Panis, L; Meeusen, R (2014). "Physical Activity, Air Pollution and the Brain." (PDF). Sports Medicine. 44 (11): 1505–18. doi:10.1007/s40279-014-0222-6. PMID 25119155.
- ↑ Innes, Emma (6 June 2014). "Air pollution 'can cause changes in the brain seen in autism and schizophrenia'". Daily Mail. Retrieved 8 June 2014.
- ↑ McEnaney, Michael (7 June 2014). "Air pollution link discovered to autism, schizophrenia risks". Retrieved 8 June 2014.
- ↑ "New Evidence Links Air Pollution to Autism, Schizophrenia". University of Rochester Medical Center. 6 June 2014. Retrieved 8 June 2014.
- ↑ "New Study Demonstrates Indoor Building Environment Has Significant, Positive Impact on Cognitive Function". New York Times. 26 October 2015.
- ↑ Allen, Joseph G.; MacNaughton, Piers; Satish, Usha; Santanam, Suresh; Vallarino, Jose; Spengler, John D. (2015). "Associations of Cognitive Function Scores with Carbon Dioxide, Ventilation, and Volatile Organic Compound Exposures in Office Workers: A Controlled Exposure Study of Green and Conventional Office Environments". Environmental Health Perspectives. doi:10.1289/ehp.1510037.
- ↑ India air pollution 'cutting crop yields by almost half' The Guardian, 3 November 2014
- 1 2 Common Dreams, 8 September 2016, "Making Case for Clean Air, World Bank Says Pollution Cost Global Economy $5 Trillion: Impact is Most Severe in Developing Nations Where 93% of Deaths and Nonfatal Illnesses Attributed to Air Pollution Worldwide Occurred in 2013," http://www.commondreams.org/news/2016/09/08/making-case-clean-air-world-bank-says-pollution-cost-global-economy-5-trillion
- 1 2 World Bank Group, 2016, "The Cost of Air Pollution: Strengthening the Economic Case for Action," by The World Bank and the Institute for Health Metrics and Evaluation at the University of Washington, http://documents.worldbank.org/curated/en/781521473177013155/pdf/108141-REVISED-Cost-of-PollutionWebCORRECTEDfile.pdf
- ↑ Simi Chakrabarti. "20th anniversary of world's worst industrial disaster". Australian Broadcasting Corporation.
- ↑ Bell, Michelle L.; Michelle L. Bell; Devra L. Davis; Tony Fletcher (January 2004). "A Retrospective Assessment of Mortality from the London Smog Episode of 1952: The Role of Influenza and Pollution". Environ Health Perspect. 112 (1): 6–8. doi:10.1289/ehp.6539. PMC 1241789
 . PMID 14698923.
 - ↑ Meselson M, Guillemin J, Hugh-Jones M, et al. (November 1994). "The Sverdlovsk anthrax outbreak of 1979" (PDF). Science. 266 (5188): 1202–8. doi:10.1126/science.7973702. PMID 7973702.
- ↑ Davis, Devra (2002). When Smoke Ran Like Water: Tales of Environmental Deception and the Battle Against Pollution. Basic Books. ISBN 0-465-01521-2.
- ↑ Interseasonal Heat Transfer
- ↑ J. C. Fensterstock , J. A. Kurtzweg & G. Ozolins (1971): Reduction of Air Pollution Potential through Environmental Planning, Journal of the Air Pollution Control Association, 21:7, 395-399
- ↑ Fensterstock, Ketcham and Walsh, The Relationship of Land Use and Transportation Planning to Air Quality Management, Ed. George Hagevik, May 1972.
- 1 2 Mark Z. Jacobson et al.: 100% clean and renewable wind, water, and sunlight (WWS) all-sector energy road maps for the 50 United States. In: Energy and Environmental Science (2015), doi:10.1039/C5EE01283J.
- ↑ Jason Palmer (12 November 2011). "'Smog-eating' material breaking into the big time". BBC News.
- ↑ "Nanotechnology to gobble up pollution". BBC News. Retrieved 29 October 2014.
- ↑ "Environment Canada - Air - Air Quality". Ec.gc.ca. 2007-09-10. Retrieved 2011-11-11.
- ↑ "Environment Canada - Air - AQHI categories and explanations". Ec.gc.ca. 2008-04-16. Retrieved 2011-11-11.
- ↑ "Air pollution hot spot". Retrieved 24 April 2014.
- ↑ Pettit, David (14 December 2014). "Global Toll of Air Pollution: Over 3 Million Deaths Each Year". Switchboard NRDC.
- 1 2 Drury, Richard; Belliveau, Michael; Kuhn, J Scott; Shipra, Bansal (Spring 1999). "Pollution Trading and Environmental Justice: Los Angeles' Failed Experiment in Air Pollution Policy". Duke Environmental Law & Policy Forum. 9 (231).
- 1 2 Morello-Frosch, Rachel; Zuk, Miriam; Jerrett, Michael; Shamasunder, Bhavna; Kyle, Amy D. (2011). "Understanding the Cumulative Impacts of Inequalities in Environmental Health: Implications for Policy". Health Affairs. 30: 879–887. doi:10.1377/hlthaff.2011.0153.
- ↑ "Racial and Socioeocnomic Disparities in Residential Proximity". American Journal of Public Health. 99 (3): S649–S656. 2009. doi:10.2105/ajph.2007.131383.
- ↑ Lerner, Steve (2010). "Sacrifice Zones: The Front Lines of Toxic Chemical Exposure in the United States". Port Arthur, Texas: Public Housing Residents Breathe Contaminated Air from Nearby Refineries and Chemical Plants. MIT Press.
- ↑ Ostachuk, A.; Evelson, P.; Martin, S.; Dawidowski, L.; Yakisich, J.S.; Tasat, D.R. (2008). "Age-related lung cell response to urban Buenos Aires air particle soluble fraction". Environmental Research. 107 (2): 170–177. doi:10.1016/j.envres.2008.01.007.
- ↑ Michelozzi, P.; Forastiere, F.; Fusco, D.; Perucci, C. A.; Ostro, B.; Ancona, C.; Pallotti, G. (1998). "Air Pollution and Daily Mortality in Rome, Italy". Occupational and Environmental Medicine. 55 (9): 605–610. doi:10.1136/oem.55.9.605. JSTOR 27730990. PMC 1757645. PMID 9861182.
- ↑ The Daily Telegraph 8 January 2014 'Air pollution killing up to 500,000 Chinese each year, admits former health minister'.
- ↑ "NATA | National-Scale Air Toxics Assessments | Technology Transfer Network Air Technical Web Site | US EPA". Epa.gov. 2006-06-28. Retrieved 2012-12-11.
- ↑ "World Bank Statistics" (PDF). Retrieved 2010-08-29.
- 1 2 Europa (1996). "Summaries of EU legislation - Management and quality of ambient air". Retrieved 24 January 2015.
- ↑ European Court of Justice, CURIA (2008). "PRESS RELEASE No 58/08 Judgment of the Court of Justice in Case C-237/07" (PDF). Retrieved 24 January 2015.
- ↑ European Commission. "Air quality: Commission sends final warning to UK over levels of fine particle pollution". Archived from the original on 11 May 2011. Retrieved 7 April 2011.
- ↑ House of Commons Environmental Audit Committee (2010). "Environmental Audit Committee - Fifth Report Air Quality". Retrieved 24 January 2015.
- 1 2 Guardian (11 March 2011). "Britain fends off threat of £300m fine over London air pollution". Guardian. Retrieved 24 January 2015.
- ↑ London Assembly Environment Committee (2009). "Every Breath You Take" (PDF). Retrieved 22 February 2015.
- ↑ BBC (2010) (2010-12-06). "Threat to sue over London congestion charge scrapping". BBC News. Retrieved 24 January 2015.
- ↑ Risse-Kappen, T (1995). Bringing transnational relations back in: non-state actors, domestic structures, and international institutions. Cambridge: Cambridge University Press. pp. 3–34.
- 1 2 3 Pattberg, P; Stripple, J. (2008). "Beyond the public and private divide: remapping transnational climate governance in the 21st century". International Environmental Agreements: Politics, Law and Economics. 8 (4).
- ↑ Roman, M (2010). "Governing from the middle: the C40 Cities Leadership Group". Corporate Governance. 10 (1).
- 1 2 Beychok, M.R. (2005). Fundamentals of Stack Gas Dispersion (4th ed.). author-published. ISBN 0-9644588-0-2. www.air-dispersion.com
- ↑ Turner, D.B. (1994). Workbook of atmospheric dispersion estimates: an introduction to dispersion modeling (2nd ed.). CRC Press. ISBN 1-56670-023-X.
Further reading
- Brimblecombe, Peter. The Big Smoke: A History of Air Pollution in London Since Medieval Times (Methuen, 1987)
- Brimblecombe, Peter. "History of air pollution." in Composition, Chemistry and Climate of the Atmosphere (Van Nostrand Reinhold (1995): 1-18
- Brimblecombe, Peter; Makra, László (2005). "Selections from the history of environmental pollution, with special attention to air pollution. Part 2*: From medieval times to the 19th century". International journal of environment and pollution. 23 (4): 351–367. doi:10.1504/ijep.2005.007599.
- Cherni, Judith A. Economic Growth versus the Environment: The Politics of Wealth, Health and Air Pollution (2002) online
- Corton, Christine L. London Fog: The Biography (2015)
- Currie, Donya. "WHO: Air Pollution a Continuing Health Threat in World's Cities," The Nation's Health (February 2012) 42#1 online
- Dewey, Scott Hamilton. Don't Breathe the Air: Air Pollution and US Environmental Politics, 1945-1970 (Texas A & M University Press, 2000)
- Gonzalez, George A. The politics of air pollution: Urban growth, ecological modernization, and symbolic inclusion (SUNY Press, 2012)
- Grinder, Robert Dale (1978). "From Insurgency to Efficiency: The Smoke Abatement Campaign in Pittsburgh before World War I.". Western Pennsylvania Historical Magazine. 61 (3): 187–202.
- Grinder, Robert Dale. "The Battle for Clean Air: The Smoke Problem in Post-Civil War America" in Martin V. Melosi, ed., Pollution & Reform in American Cities, 1870-1930 (1980), p83-103.* Mosley, Stephen. The chimney of the world: a history of smoke pollution in Victorian and Edwardian Manchester. Routledge, 2013.
- Schreurs, Miranda A. Environmental Politics in Japan, Germany, and the United States (Cambridge University Press, 2002) online
- Thorsheim, Peter. Inventing Pollution: Coal, Smoke, and Culture in Britain since 1800 (2009)
External links
| Wikimedia Commons has media related to Air pollution. |
| Library resources about Air pollution |
- Global real-time air quality index map
- International Conference on Urban Air Quality.
- UNEP Urban Issues
- European Commission > Environment > Policies > Air >Air Quality
- Database: outdoor air pollution in cities from the World Health Organisation
- World Health Organization Fact Sheet on Air quality and health
- Impact assessment of the mortality effects of longer-term exposure to air pollution: exploring cause-specific mortality and susceptibility by BG Miller. Institute of Occupational Medicine Research Report TM/03/01
- The Mortality Effects of Long-Term Exposure to Particulate Air Pollution in the United Kingdom, UK Committee on the Medical Effects of Air Pollution, 2010.
- Ozone Pollution at EPA.gov
| Air |
|  | ||||||
|---|---|---|---|---|---|---|---|---|
| Energy | ||||||||
| Land | ||||||||
| Life | ||||||||
| Water |
| |||||||
| Related |
| |||||||
| ||||||||
| ||||||||