1979 Atlantic hurricane season
 | |
| Season summary map | |
| First system formed | June 11, 1979 |
|---|---|
| Last system dissipated | November 15, 1979 |
| Strongest storm1 | David – 924 mbar (hPa) (27.29 inHg), 175 mph (280 km/h) (1-minute sustained) |
| Total depressions | 27 |
| Total storms | 9 |
| Hurricanes | 5 |
| Major hurricanes (Cat. 3+) | 2 |
| Total fatalities | 2136 |
| Total damage | $4.637 billion (1979 USD) |
| 1Strongest storm is determined by lowest pressure | |
1977, 1978, 1979, 1980, 1981 | |
The 1979 Atlantic hurricane season was the first season to include both male and female names, as well as the common six-year rotating lists of tropical cyclone names. The season officially began on June 1, and lasted until November 30. These dates conventionally delimit the period of each year when most tropical cyclones form in the Atlantic basin.[1] It was slightly below average, with nine systems reaching tropical storm intensity. The first system, an unnumbered tropical depression, developed north of Puerto Rico on June 9. Two days later, Tropical Depression One formed and produced severe flooding in Jamaica, with 40 deaths and about $27 million (1979 USD) in damage.[nb 1] Tropical Storm Ana caused minimal impact in the Lesser Antilles. Hurricane Bob spawned tornadoes and produced minor wind damage along the Gulf Coast of the United States, primarily in Louisiana, while the remnants caused flooding, especially in Indiana. Tropical Storm Claudette caused extensive flooding, due to torrential rainfall. There were two deaths and damaged totaled $750 million.
The most intense tropical cyclone of the season was Hurricane David. It moved across the Lesser Antilles in late August, with the worst hit islands being Dominica and Martinique. The storm then strengthened further and struck Dominican Republic as a Category 5 hurricane. David was the strongest and deadliest tropical cyclone to make landfall in that country since 1930. In Dominican Republic alone, the system caused approximately 1,000 death and $1 billion in damage. Later, David brought wind damage, tornadoes, and flooding to portions of the East Coast of the United States. Overall, the storm resulted in 2,068 deaths and $1.54 billion in damage. Hurricane Frederic brought destruction to the Gulf Coast of the United States, especially in Alabama and Mississippi. With $2.3 billion in damage, Frederic was the costliest hurricane in the history of the United States, until Hurricane Hugo in 1989.
Tropical Storm Elena brought flooding to the Greater Houston area, with five deaths and about $10 million in damage. However, little impact was reported elsewhere. Hurricane Henri remained offshore in the Gulf of Mexico and disrupted efforts to stop the Ixtoc I oil spill. Henri also caused flooding in portions of Mexico. In mid and late-September, a tropical depression caused flooding in the Southern United States, especially Texas. Four deaths were reported, two in Texas and two in Kentucky. Toward the end of October, a brief subtropical storm struck Newfoundland, but left little impact. Other than Tropical Depression One and the tropical depression that brought flooding to the Southern United States in mid and late-September, none of the other depressions caused significant effects of land. Collectively, the tropical cyclones of the season resulted in $4.63 billion in damage and at least 2,136 deaths. Pacific Storm Blanca originated in the basin.
Season summary


The Atlantic hurricane season officially began on June 1, 1979.[1] Although 27 tropical cyclones developed,[2][3] only nine of them reach tropical storm intensity,[3] which is slightly below the 1950-2000 average of 9.6 named storms per season.[4] Of the nine tropical storms, five of them strengthened into a hurricane,[3] which is also slightly below average.[4] Two of the five hurricane became major hurricanes,[3] which is Category 3 or greater on the Saffir–Simpson hurricane wind scale.[5] Three tropical storms, one subtropical storm, and three hurricanes made landfall during the season and caused at least 2,136 fatalities and $4.63 billion.[6] Despite its intensity, Tropical Depression One also resulted in damage and deaths due to severe flooding in Jamaica. The last storm of the season, an unnumbered tropical depression, dissipated on November 15, about 15 days before the official end of hurricane season on November 30.[1]
Tropical cyclogenesis began in June, with three tropical depressions, one of which strengthened into Tropical Storm Ana. A total of four systems formed in the month of July, including Hurricane Bob and Tropical Storm Claudette. Activity briefly halted after Tropical Depression Six dissipated on August 6 and lasted until Hurricane David developed on August 25. There were four other tropical cyclones that month, including Hurricane Frederic and Tropical Storm Elena. In September, six systems developed, with the named storms of the month being hurricane Gloria and Henri. October was slightly less active, with four tropical cyclones, one of which was an unnamed subtropical storm. Two additional tropical depressions developed in November, the second of which dissipated on November 15.[2]
The season's activity was reflected with an accumulated cyclone energy (ACE) rating of 93.[5] ACE is, broadly speaking, a measure of the power of the hurricane multiplied by the length of time it existed, so storms that last a long time, as well as particularly strong hurricanes, have high ACEs. It is only calculated for full advisories on tropical systems at or exceeding 39 mph (63 km/h), which is tropical storm strength. Although officially, subtropical storms are not included in the ACE value,[7] the periods when storms were in a subtropical phase.[5] [8]
Storms
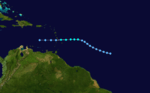
Tropical Depression One
| Tropical depression (SSHWS) | |||
|---|---|---|---|
| |||
| Duration | June 11 – June 16 | ||
| Peak intensity | 35 mph (55 km/h) (1-min) 1005 mbar (hPa) | ||


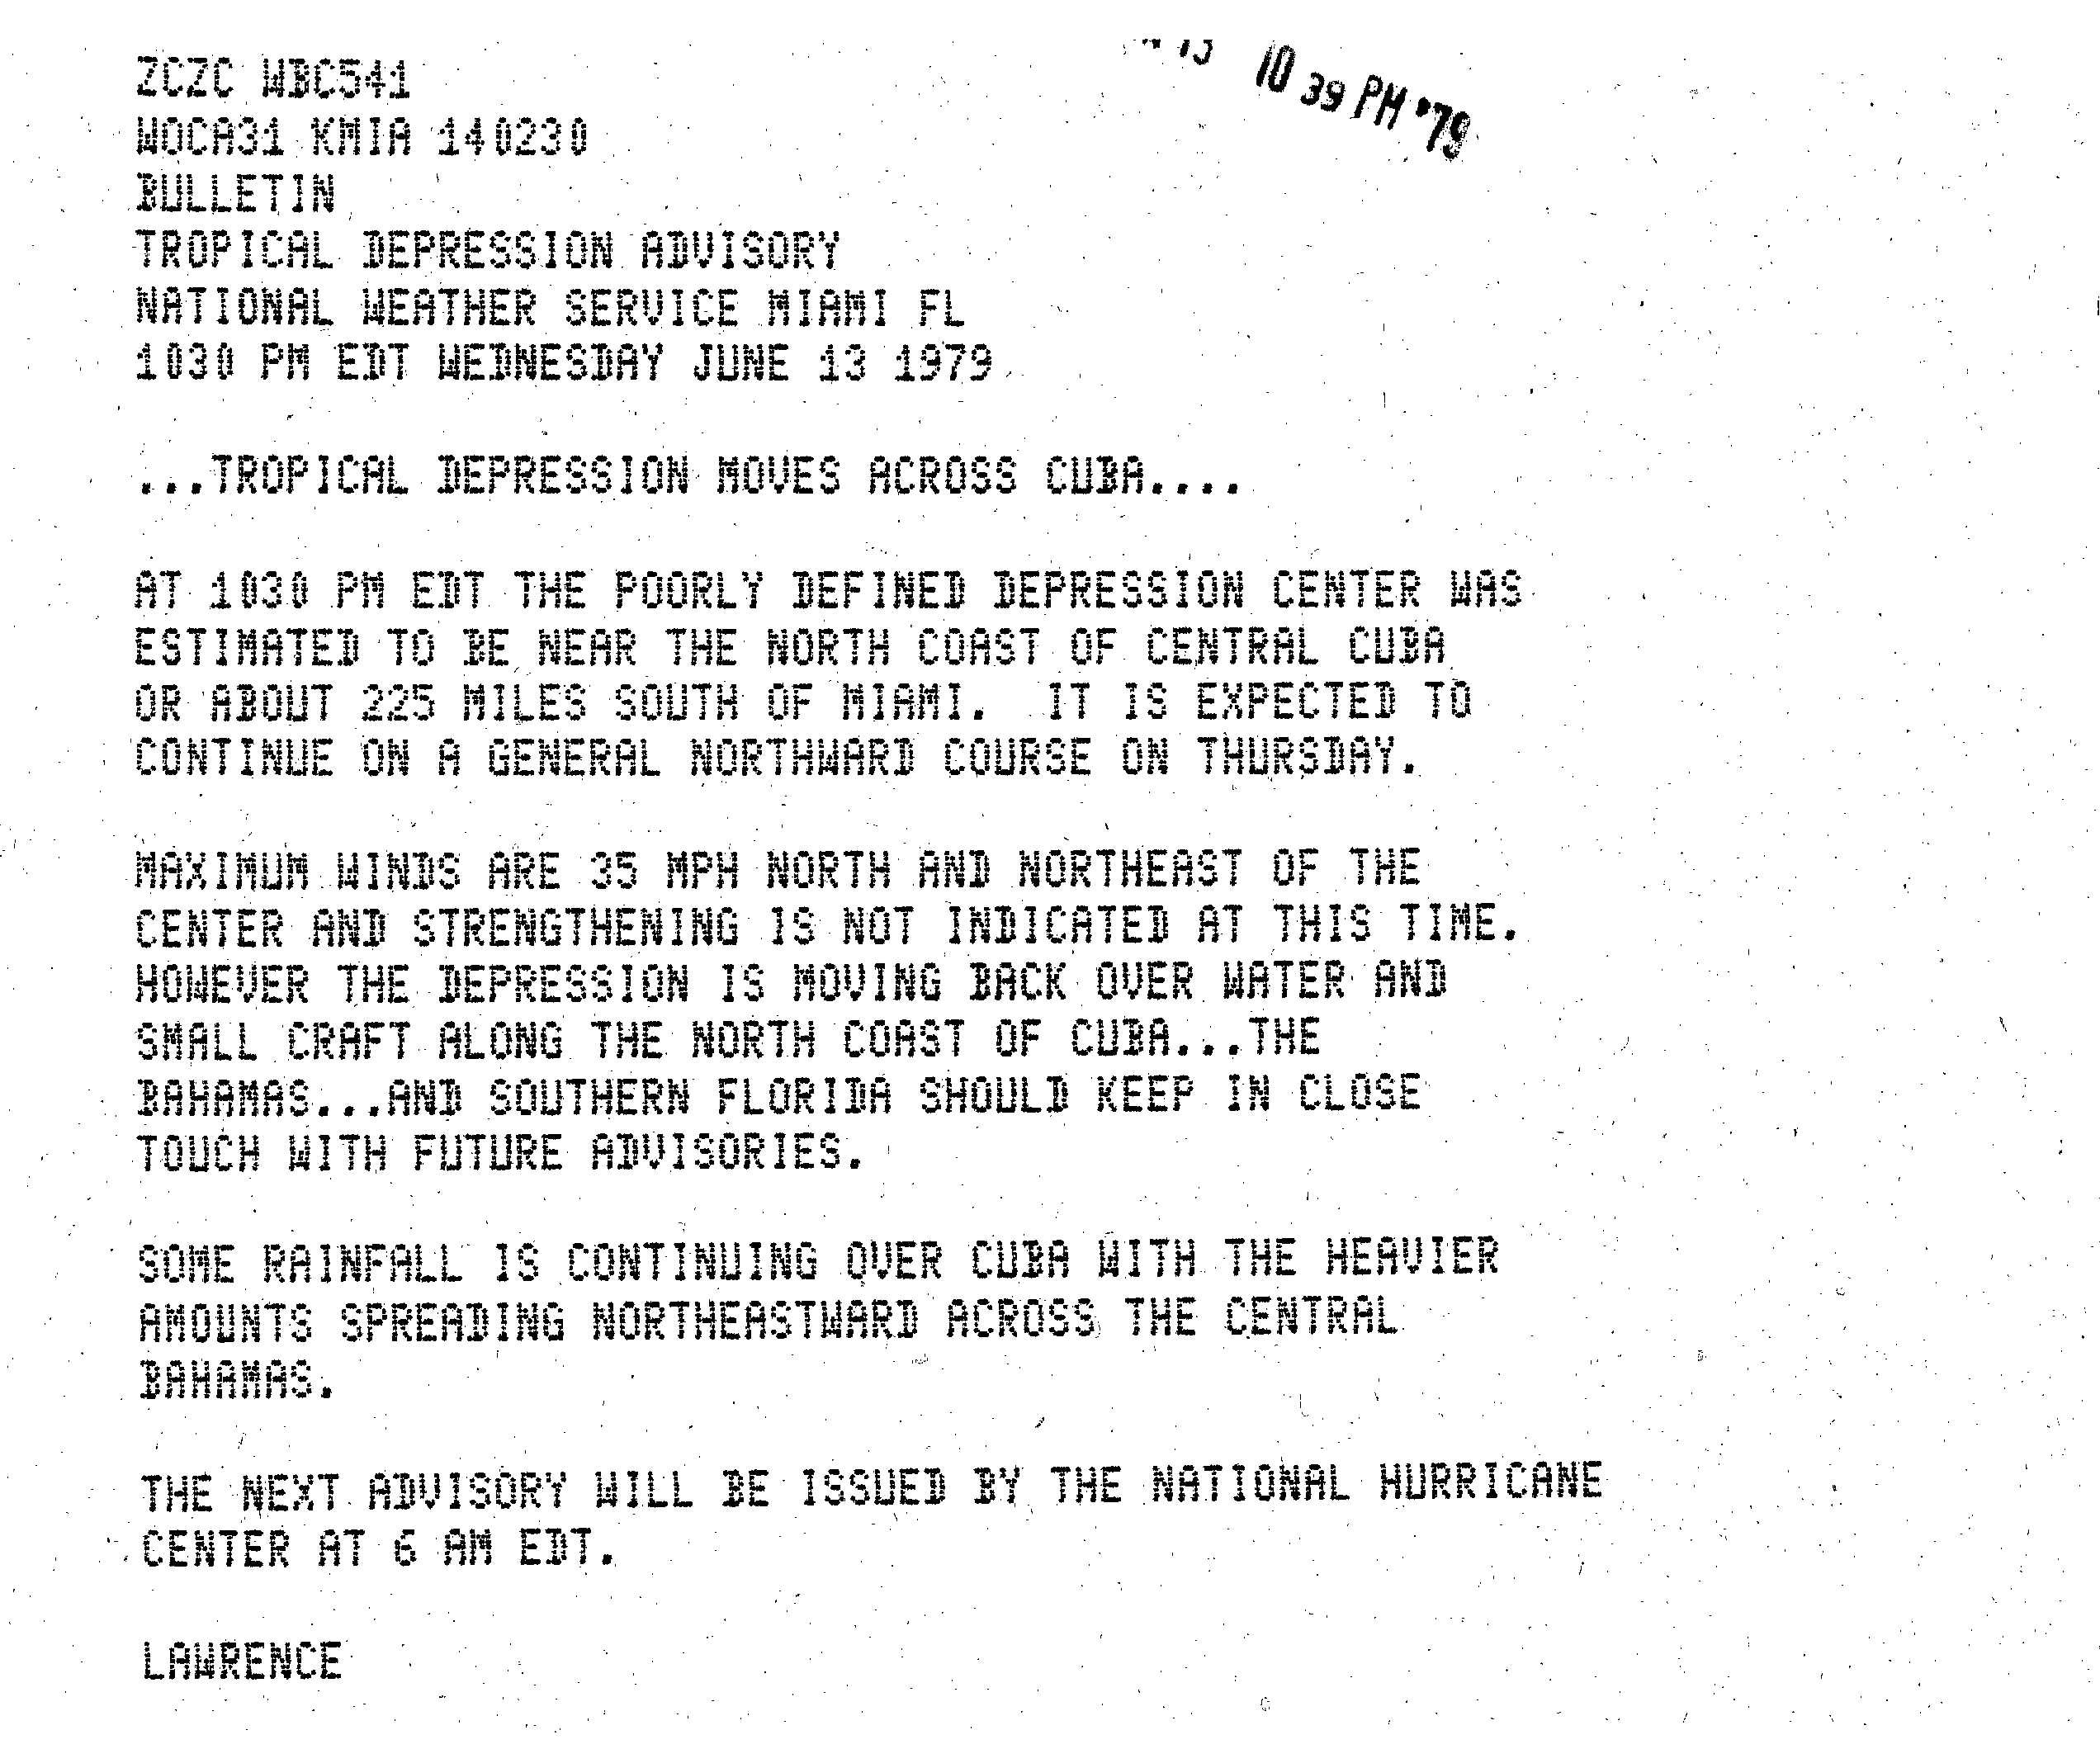
A tropical wave in the western Caribbean Sea situated south of Grand Cayman developed into a tropical depression on June 11.[9][3] Tracking generally northward, the depression passed west of Jamaica. On June 12, the depression peaked with maximum sustained winds of 35 mph (55 km/h) system, having never reached tropical storm status. The following day, it made landfall in Cuba.[9][3] Early on June 14, the depression emerged into the western Atlantic Ocean and then moved parallel to the east coast of Florida for a few days. The depression made another landfall in South Carolina on June 16 and dissipated hours later.[3]
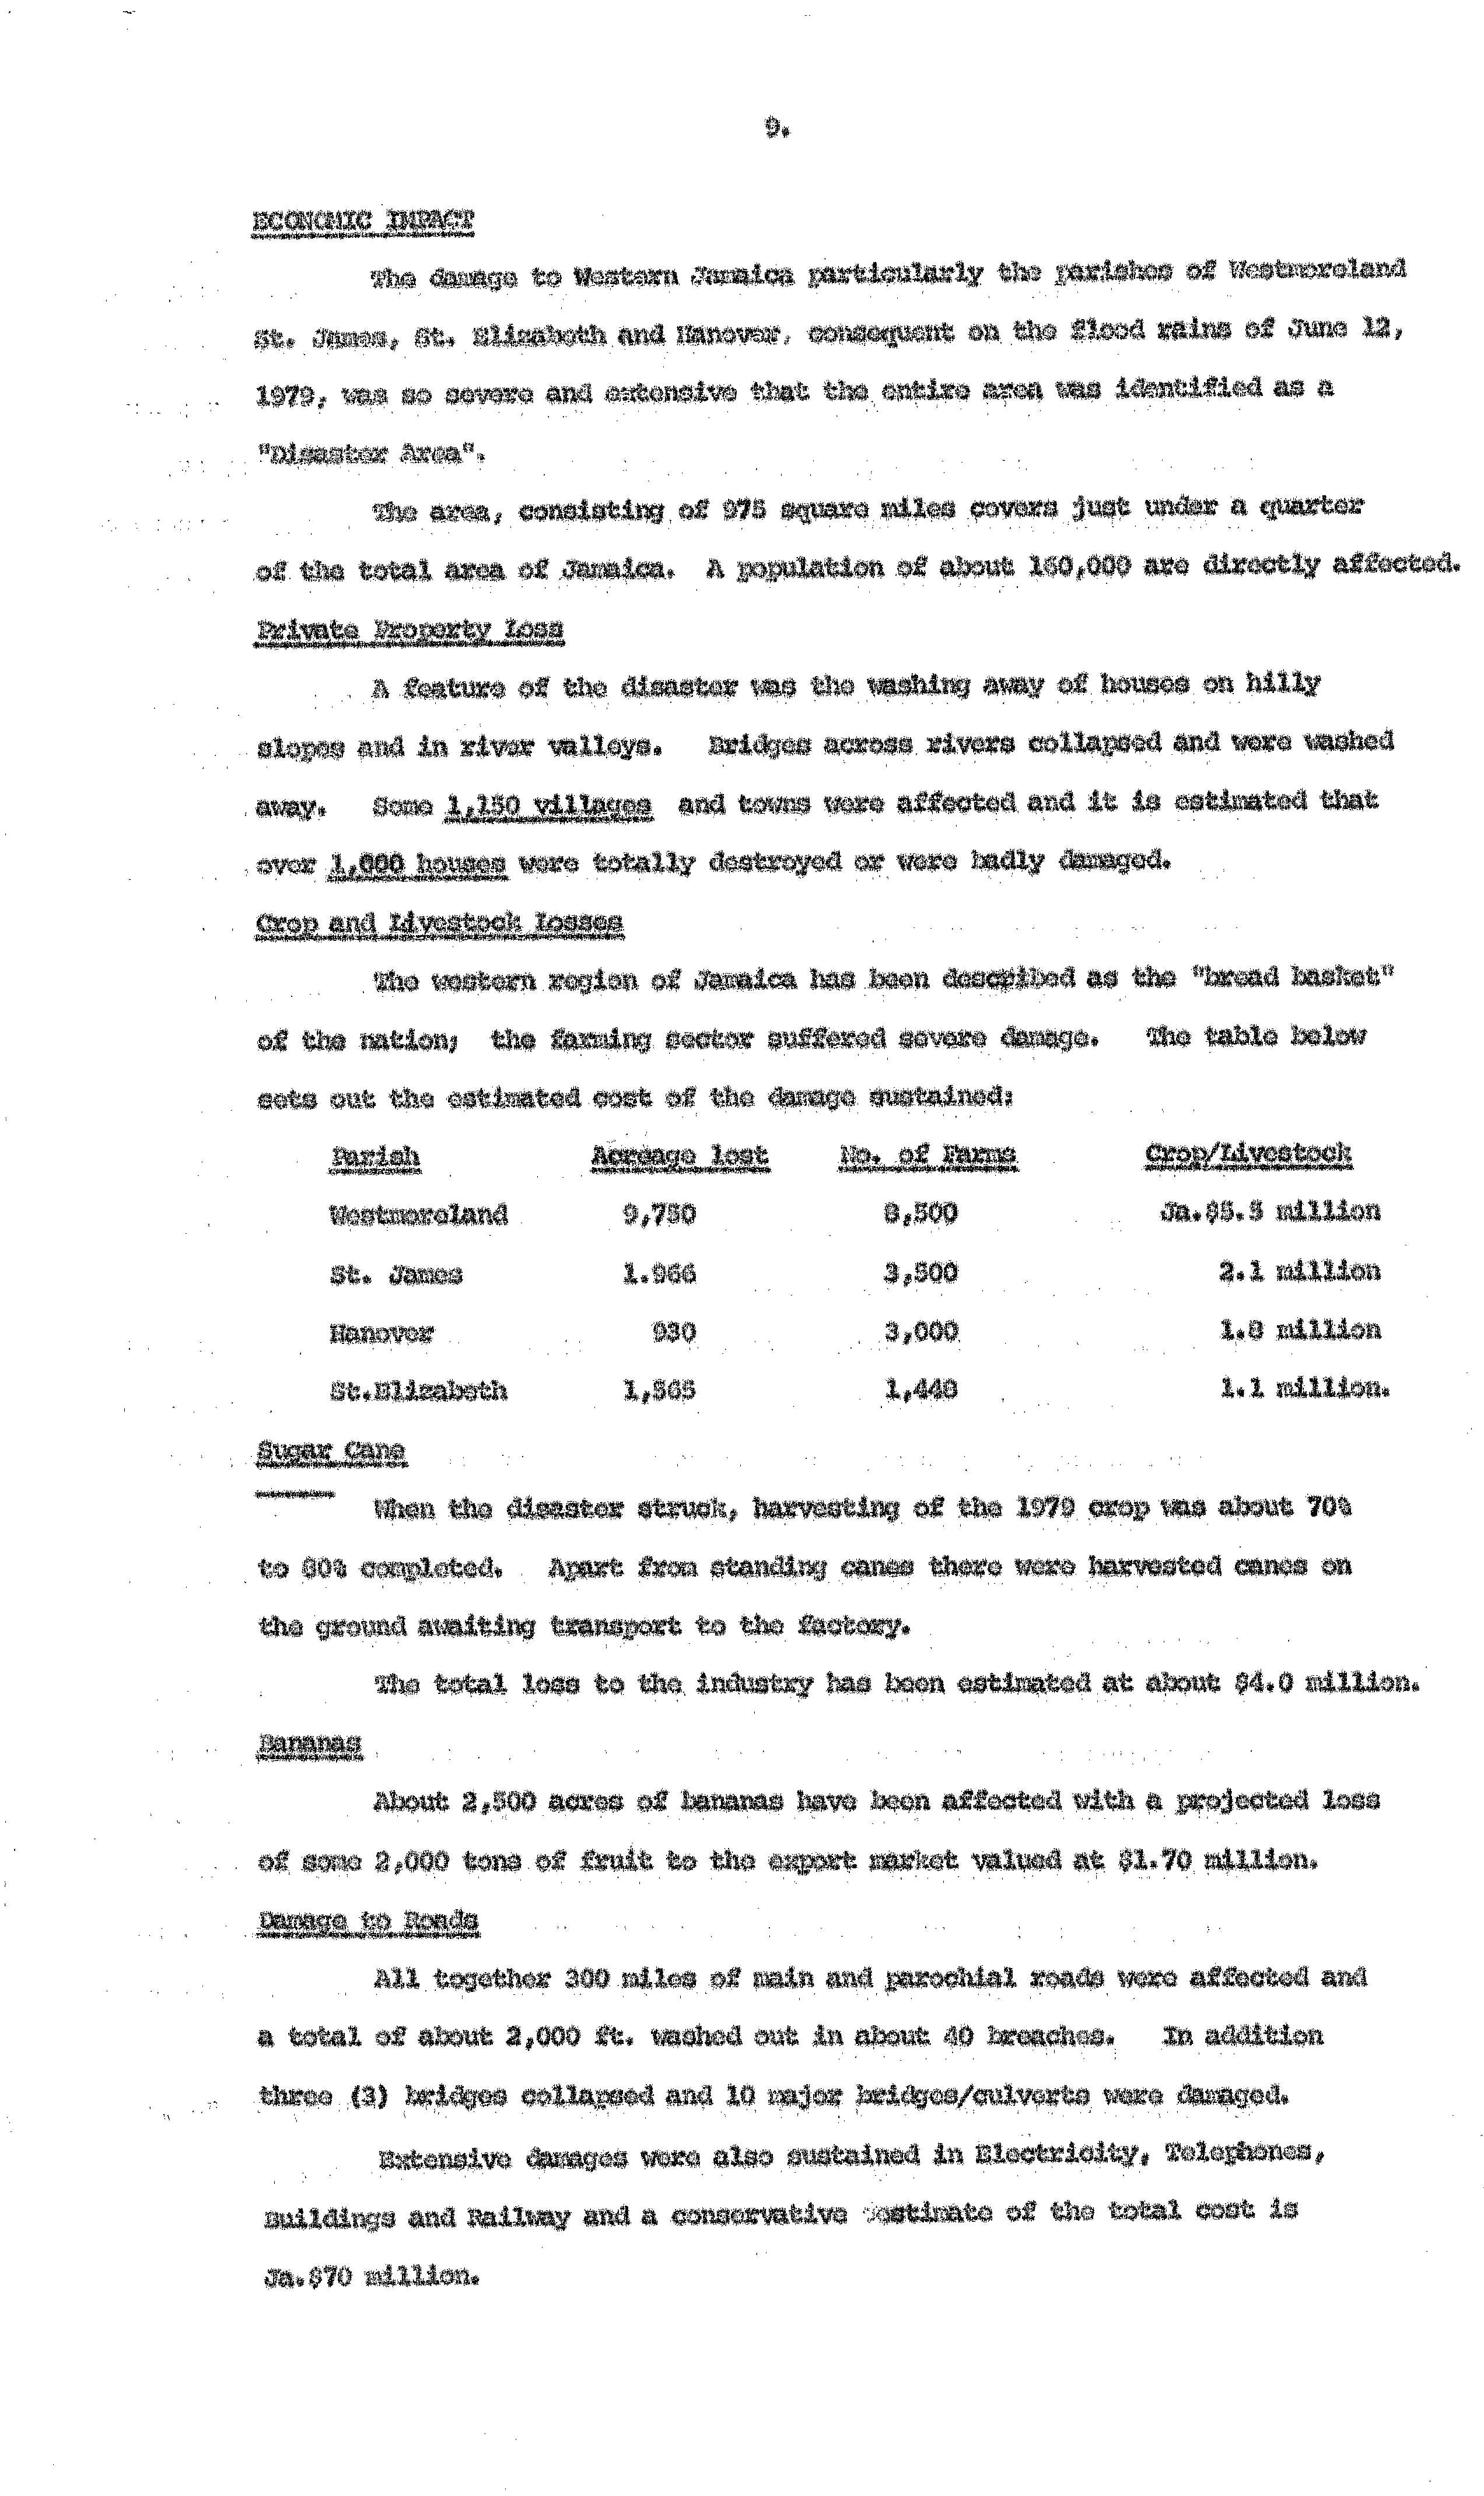
The slow movement of the depression to the west of Jamaica resulted in torrential rainfall, peaking at 32 in (810 mm) in Friendship, a city in Westmoreland Parish.[9] Throughout western Jamaica, about 1,000 homes were destroyed or severely damaged,[10] while up to 40,000 people were rendered homeless.[11] The city of New Market was submerged for at least six months.[12] Crops, electricity, telephones, buildings, and railways also suffered damage during the disaster.[10] There were 40 deaths and approximately $27 million in damage.[13] The depression also brought heavy precipitation to the Bahamas and Cuba.[14] Along the East Coast of the United States, light rainfall,[15] strong winds,[16] and rough seas were observed. In South Carolina, a person went missing and was later presumed to have drowned after their boat was torn loose from its mooring.[17]
Tropical Storm Ana
| Tropical storm (SSHWS) | |||
|---|---|---|---|
| |||
| Duration | June 19 – June 24 | ||
| Peak intensity | 60 mph (95 km/h) (1-min) 1005 mbar (hPa) | ||

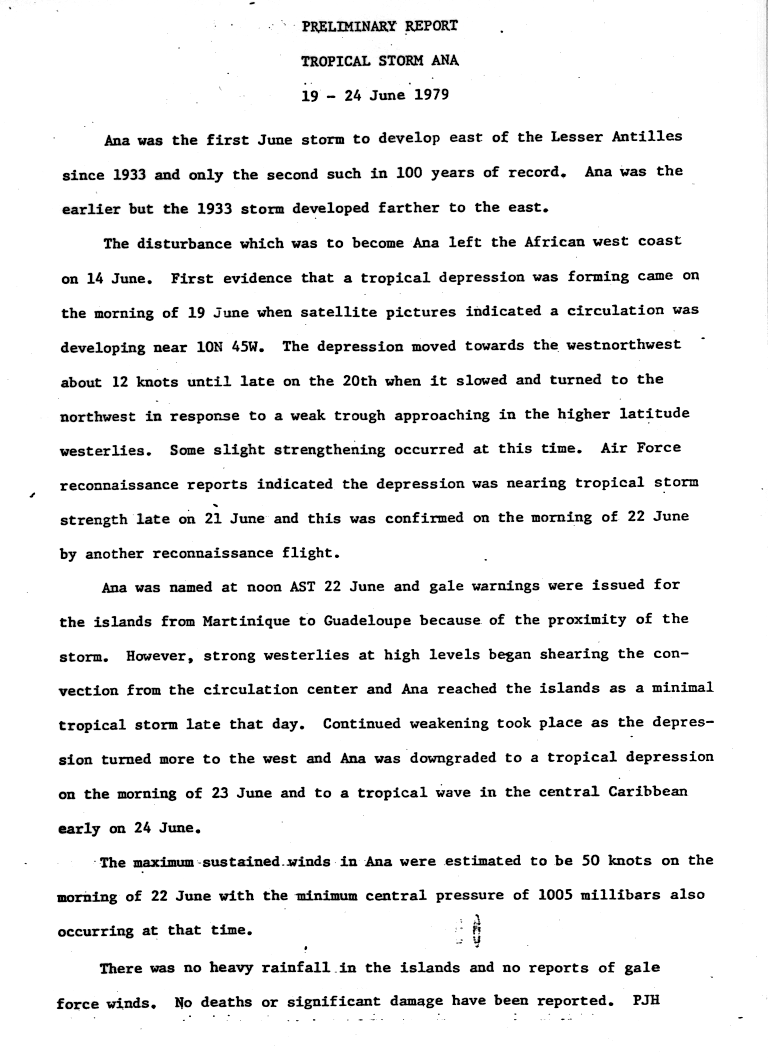
A tropical wave exited the west coast of Africa and entered the Atlantic on June 14. It headed westward and after satellite imagery indicated a closed circulation, the wave was classified as a tropical depression on June 19, while located several hundred miles east-southeast of the Windward Islands. The system was the first tropical cyclone to develop east of the Lesser Antilles in June since the 1933 Trinidad hurricane;[18] more recently, a tropical depression in 2000 and another in 2003 formed further east in that month.[19][20] Initially, the depression tracked west-northwestward, before curving northwestward by late on June 20.[18]
A United States Air Force reconnaissance aircraft noted that the depression was strengthening and by early on June 22, it was upgraded to Tropical Storm Ana. Thereafter, the storm began tracking almost due westward toward the Lesser Antilles. Ana peaked with winds of 60 mph (95 km/h), before wind shear began detaching deep convection from the center, resulting in weakening. Early on June 23, the storm struck St. Lucia and then fell to tropical depression intensity upon entering the Caribbean Sea. Ana continued weakening and degenerated back into a tropical wave on June 24, while located between Puerto Rico and Venezuela.[18] Despite directly crossing St. Lucia, only light rainfall occurred. In Dominica, rain fell for 15 hours and gusty winds were reported.[21]
Hurricane Bob
| Category 1 hurricane (SSHWS) | |||
|---|---|---|---|
| |||
| Duration | July 9 – July 16 | ||
| Peak intensity | 75 mph (120 km/h) (1-min) 986 mbar (hPa) | ||


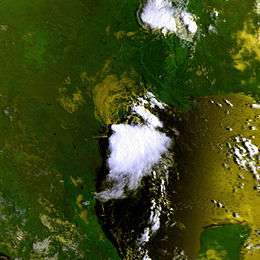
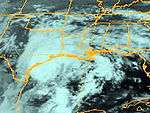
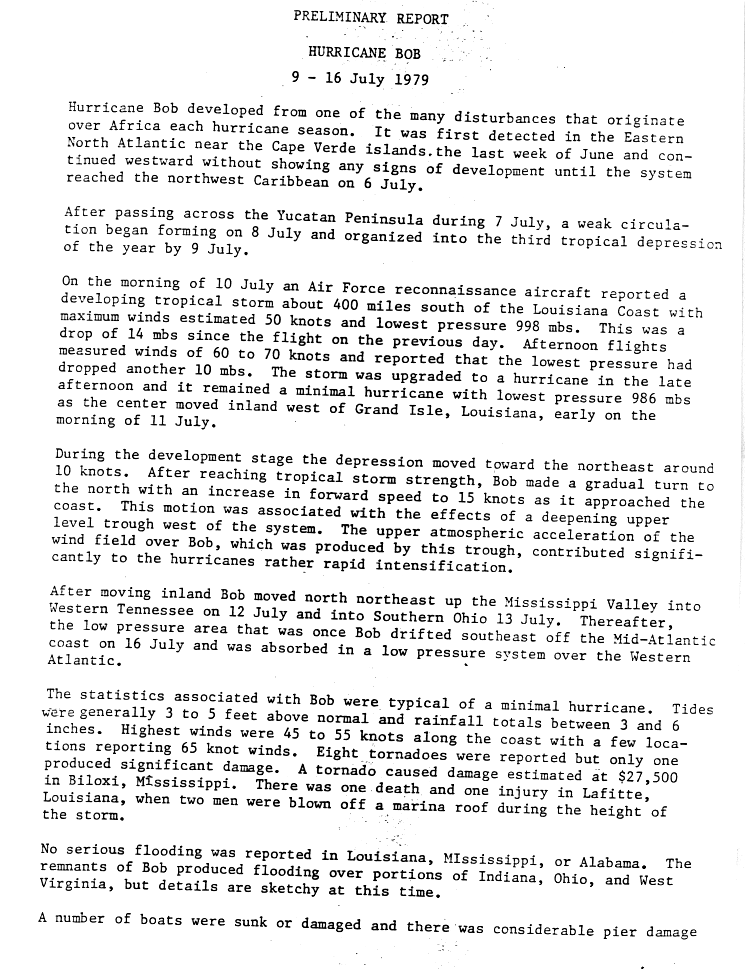
A tropical wave developed into a tropical depression in the southwestern Gulf of Mexico on July 9. Tracking in a general northward direction, favorable conditions allowed for quick strengthening. Less than a day after formation, the system reached tropical storm intensity, followed by hurricane intensity on July 11.[22] Shortly after strengthening into a hurricane, Bob reached its peak intensity with maximum sustained winds of 75 mph (121 km/h).[3] At the same intensity, Bob made landfall west of Grand Isle, Louisiana, and rapidly weakened after moving inland. However, the resulting tropical depression persisted for several days as it paralleled the Mississippi and Ohio rivers. On July 16, the system emerged into the western Atlantic, where it was subsequently absorbed by a nearby low-pressure area.[22]
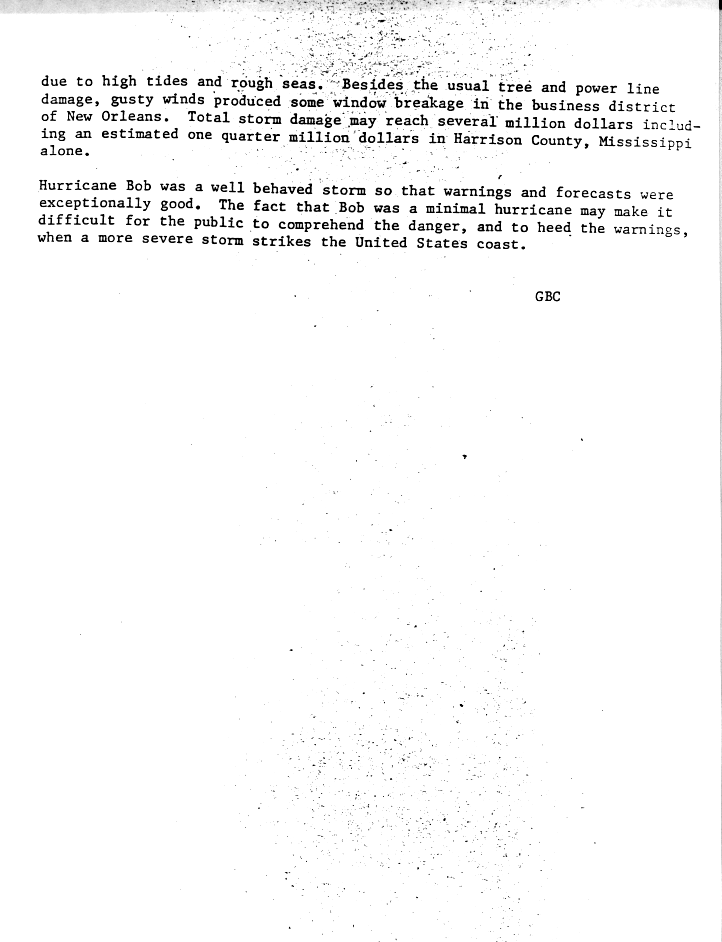
Widespread offshore and coastal evacuations took place along the Gulf Coast of the United States in preparation for Hurricane Bob.[23] Effects from the hurricane on the United States were mostly marginal and typical of a minimal hurricane. The cyclone produced a moderate storm surge, damaging some coastal installments and causing coastal inundation.[22] Strong winds were also associated with Bob's landfall, though no stations observed winds of hurricane force.[9] The winds downed trees and blew out windows, in addition to causing widespread power outages.[24] Heavy rainfall was also reported in some locations, peaking at 7.16 in (182 mm) in Louisiana.[25] Further inland, the torrential rains led to flooding in Indiana, resulting in more considerable damage as opposed to the coast. Bob also spawned eight tornadoes,[22] with two causing significant damage.[22][26] Overall, Bob was responsible for one death and $20 million in damage.[9][22]
Tropical Storm Claudette
| Tropical storm (SSHWS) | |||
|---|---|---|---|
| |||
| Duration | July 16 – July 29 | ||
| Peak intensity | 50 mph (85 km/h) (1-min) 997 mbar (hPa) | ||

A tropical wave spawned a tropical depression east of the Lesser Antilles on July 16. It gradually strengthened into Tropical Storm Claudette on July 17 and crossed the northern Leeward Islands later that day. As the storm approached Puerto Rico early on July 18, it weakened back to a tropical depression. Claudette degenerated back into a tropical wave after crossing Puerto Rico. Late on July 18, the remnants struck Dominican Republic and emerged into the Caribbean Sea on the following day. The system crossed western Cuba on July 21, shortly before reaching the Gulf of Mexico and regenerated into a tropical cyclone. By July 23, Claudette regained tropical storm intensity and turned northward. The storm made landfall near the Texas-Louisiana border later that day. It eventually dissipated over West Virginia on July 29.[9]
In the Lesser Antilles, the storm brought heavy rainfall and gusty winds to several islands. Minor flooding occurred in Saint Croix. Rainfall exceeding 10 inches (250 mm) in some areas of Puerto Rico led to widespread agricultural damage, flooded homes and streets. There was one fatality and approximately $750,000 in damage.[26] Up to 42 inches (1,100 mm) of rain fell in one day in Alvin, Texas, which is the record 24‑hour precipitation amount for any location in the United States. Within the state of Texas alone, hundreds of businesses and an estimated 15,000 homes sustained flood damage. Rice crops were also ruined.[27] One drowning death was reported in the state.[9] In Louisiana, extensive coastal flooding occurred, with miles of roads battered or destroyed in Cameron Parish, while several boats along the coast capsized. At Johnson Bayou, fishing camps and homes suffered damage or destruction. Further inland, other states experienced freshwater flooding, especially Indiana and Missouri.[26] Overall, Claudette was responsible for two deaths and $750 million in losses.[9][27]
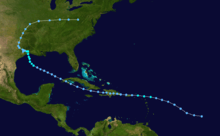
Hurricane David
| Category 5 hurricane (SSHWS) | |||
|---|---|---|---|
| |||
| Duration | August 25 – September 6 | ||
| Peak intensity | 175 mph (280 km/h) (1-min) 924 mbar (hPa) | ||
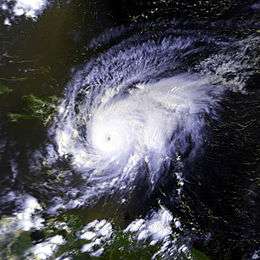

A tropical wave developed into a tropical depression at 12:00 UTC on August 25, while located about 870 mi (1,400 km) southeast of Cape Verde.[9] Moving westward, the depression intensified into Tropical Storm David early the next day. Shortly after attaining hurricane status on August 27, David rapidly deepened. By 12:00 UTC the following day, it was a strong Category 4 hurricane. Thereafter, the storm oscillated in intensity while approaching the Lesser Antilles and struck Dominica late on August 29. with winds 145 mph (230 km/h). After entering the Caribbean Sea, further deepening occurred and at 18:00 UTC on August 30, David peaked with maximum sustained winds of 175 mph (280 km/h). Late on August 31, it curved northwestward and struck Santo Domingo, Dominican Republic at the same intensity.[3]
The storm rapidly weakened while crossing Hispaniola and was only a Category 1 hurricane upon emerging into the Windward Passage on September 1. Moving northwestward, David made landfall in the eastern tip of Cuba that day and briefly weakened to a tropical storm. However, after reaching the Atlantic, it re-strengthened into a Category 1. David then moved through the Bahamas and crossed Andros Island on September 2. Thereafter, the storm re-intensified into a Category 2 and made landfall near West Palm Beach, Florida late the next day. The hurricane remained barely inland and re-emerged into the Atlantic at Merritt Island early on September 4. Thereafter, the cyclone weakened slightly and made landfall in Blackbeard Island, Georgia later that day as a Category 1 hurricane. David headed north-northeastward and weakened to a tropical storm on September 5. While crossing the Mid-Atlantic states, the storm curved northeastward and accelerated, before becoming extratropical over New York late on September 6. The remnants of David persisted over New England and Atlantic Canada, before dissipating northeast of Newfoundland on September 8.[3]
In Dominica, strong winds damaged or destroyed 80% of homes, leaving 75% of the island's population homeless. Agricultural was also severely impacted, with 75% of crops ruined, including a complete loss of bananas.[28] There were 56 deaths and 180 injuries.[9][28] Similar destruction occurred on Guadeloupe and Martinique, with hundreds left homeless and extensive damage to crops. Guadeloupe and Martinique also had $50 million and $100 million in damage, respectively. In Puerto Rico, flooding and high winds combined resulted in $70 million in damage and seven fatalities, four from electrocution.[28] Dominican Republic was lashed with very strong winds and torrential rains.[9][28] Entire villages were destroyed and numerous others were left isolated because of damage or destruction to many roads.[29] Thousands of houses were destroyed, leaving over 200,000 homeless in the aftermath of the hurricane.[9] Additionally, nearly 70% of the country's crops were ruined.[29] Overall, the storm caused at least 2,000 deaths and about $1 billion in damage in Dominican Republic. Minimal impact occurred in the Bahamas, Cuba, and Haiti.[9] In Florida, strong winds left moderate damage, including a downed radio tower, snapping a crane, and deroofing buildings.[30] There were also 10 tornadoes.[31] Damage totaled approximately $95 million.[30] Other states along the East Coast of the United States experienced flooding and tornadoes. The latter was particularly severe in Virginia, with tornadoes causing one death, damaging 270 homes, and destroying three other homes.[32] Throughout the United States, there were 15 deaths and about $320 million in damage.[9]
Tropical Depression Eight
| Tropical depression (SSHWS) | |||
|---|---|---|---|
| |||
| Duration | August 25 – August 28 | ||
| Peak intensity | 35 mph (55 km/h) (1-min) 1006 mbar (hPa) | ||

A tropical disturbance formed over the Isthmus of Tehuantepec on August 24.[33] By the following day, the disturbance developed into a tropical depression,[3] operationally classified as the eight of the season. The depression entered the Bay of Campeche on August 25 and headed northward.[33] Around 06:00 UTC the following day, the system peaked with maximum sustained winds of 35 mph (55 km/h).[3] However, on August 28, a ridge of high pressure forced the system to move west-southwestward,[33] causing it make landfall in a rural area of Tamaulipas later that day.[3] The depression brought heavy rainfall to some areas of Mexico, with 18.94 in (481 mm) of precipitation observed in Santa María Xadani, Oaxaca. Rainfall extended northward into Texas, peaking at 4.86 in (123 mm) in McAllen.[33]
Hurricane Frederic
| Category 4 hurricane (SSHWS) | |||
|---|---|---|---|
| |||
| Duration | August 29 – September 14 | ||
| Peak intensity | 130 mph (215 km/h) (1-min) 943 mbar (hPa) | ||

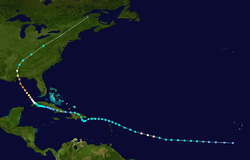
Satellite imagery and ship observations indicated that a tropical depression developed at 06:00 UTC on August 29, while located about 270 mi (430 km) south-southwest of the southernmost island of Cape Verde. By 12:00 UTC the next day, the depression strengthened into Tropical Storm Frederic. Further intensification occurred, with the storm becoming a hurricane on September 1. However, outflow from Hurricane David caused Fredric to weaken back to a tropical storm early the following day.[9] While moving across the northern Leeward Islands on September 4,[3] bringing gusty winds and heavy rainfall to some islands. In Sint Maarten, a fishing boat sank, killing seven people.[9] Strong winds were observed in the United States Virgin Islands. On Saint Thomas, the roofs of three large apartment buildings were blown off, leaving about 50 families homeless. Additionally, flooding destroyed four houses and impacted 50 others. Numerous houses on Saint Croix also suffered water damage.[34]
Around midday on September 4, Frederic made landfall in Humacao, Puerto Rico with winds of 50 mph (85 km/h).[3] Flooding on the island forced over 6,000 people to flee their homes in search of shelter. Numerous roads were closed due to landslides and inundation. At least nine cities experienced flooding.[34] After crossing Puerto Rico, Frederic briefly re-emerged into the Caribbean Sea, before making landfall near Santo Domingo, Dominican Republic with winds of 45 mph (75 km/h) at 00:00 UTC on September 6.[3] Minimal impact was reported in that country, though heavy rainfall, exceeding 24 in (610 mm) in some places, compounded damage inflicted by Hurricane David.[9] Frederic weakened further while crossing Hispaniola. Later on September 6, the system briefly re-emerged into the Atlantic Ocean, but land interaction with the island weakened it to a tropical depression. The storm crossed the Windward Passage and then made landfall in southeastern Guantánamo Province of Cuba early on September 7.[3] Due to the weak nature of Frederic, minimal impact was reported.[9] It then moved along, or just offshore the southern coast of Cuba. While situated south of Matanzas Province early on September 9, the system re-strengthened into a tropical storm. Despite land interaction with Cuba, Frederic continued to intensify.[3]
Shortly before emerging into the Gulf of Mexico on September 10, Frederic re-intensified into a hurricane. During the next few days, the storm significantly, but not rapidly, strengthened while moving northwestward. At 12:00 UTC on September 12, Frederic attained its peak intensity with maximum sustained winds of 135 mph (215 km/h) and a minimum barometric pressure of 943 mbar (27.8 inHg). Early on the next day, the storm made landfall near Dauphin Island and then near the Alabama–Mississippi state line. The storm rapidly weakened and fell to tropical storm intensity by late on September 13. Frederic then accelerated northeastward and became extratropical over New York around 18:00 UTC the next day. The remnants persisted until dissipating over New Brunswick early on September 15.[3] Frederic brought destruction to the Gulf Coast of the United States. In Alabama, storm surge up to 12 ft (3.7 m) and wind gusts as high as 145 mph (233 km/h) caused the destruction of nearly all buildings within 900 ft (270 m) of the coast.[35] In the Mobile, nearly 90% of the city lost electricity.[36] Extensive coastal damage was also reported in Mississippi, due to tides ranging from 6 to 12 ft (1.8 to 3.7 m) above normal. Hundreds of structures were severely impacted or destroyed.[34] Throughout the United States, the storm caused five deaths and approximately $2.3 billion in damage.[9][37] Thus, Frederic was the costliest tropical cyclone in the United States, until being surpassed by Hurricane Hugo in 1989.[37]
Tropical Storm Elena
| Tropical storm (SSHWS) | |||
|---|---|---|---|
| |||
| Duration | August 30 – September 2 | ||
| Peak intensity | 40 mph (65 km/h) (1-min) 1004 mbar (hPa) | ||

On August 27, a weak tropical wave crossed Florida and entered the Gulf of Mexico. Upon reaching the central Gulf of Mexico, ships, buoys, and satellite observations indicated that a tropical depression developed early on August 30,[9][3] while located about halfway between the southeastern tip of Louisiana and the north coast of the Yucatán Peninsula.[3] A reconnaissance aircraft flight confirmed the existence of a tropical depression.[9] Late on August 30, the depression strengthened into Tropical Storm Elena. Early the next day, Elena peaked with winds of 40 mph (65 km/h) and a minimum barometric pressure of 1,004 mbar (29.6 inHg).[3]
Around 12:00 UTC on September 1, the storm made landfall near Matagorda, Texas with winds of 40 mph (65 km/h). Elena rapidly weakened to a tropical depression about six hours later, before dissipating early on September 2.[3] Due to the weak nature of the storm, impact was generally minor. In Texas, precipitation peaked at 10.28 in (261 mm) at Palacios Municipal Airport.[25] Flooding occurred, with the worst impact in Harris County. Hundreds of cars were stalled or submerged in downtown Houston and 45 buses suffered water damage. Basements and the police station were also inundated. Elsewhere in the county, some homes and businesses were flooded.[34] Elena caused five deaths and less than $10 million in damage.[9]
Hurricane Gloria
| Category 2 hurricane (SSHWS) | |||
|---|---|---|---|
| |||
| Duration | September 4 – September 15 | ||
| Peak intensity | 100 mph (155 km/h) (1-min) 975 mbar (hPa) | ||


A tropical wave existed the west coast of Africa and developed into a tropical depression by September 4.[3][9] Under the influence of a trough in the westerlies, the depression northeastward and bypassed Cape Verde on September 5.[9] At 12:00 UTC on the following day, the depression was upgraded to Tropical Storm Gloria, while moving west-northwestward at about 17 mph (27 km/h). After curving abruptly north-northwestward, Gloria became a hurricane early on September 7.[3] A higher latitude frontal system and a high pressure area caused Gloria to decelerate and resulted in a westward motion beginning on September 9.[9]
Gloria briefly weakened to a tropical storm late on September 10, but re-strengthened into a hurricane on the following day. Eventually, the hurricane turned northeastward and began to accelerate. At 1800 UTC on September 12, Gloria attained its peak intensity with winds of 100 mph (155 km/h) and a minimum barometric pressure of 975 mbar (28.8 inHg). The storm then began weakening and fell to Category 1 hurricane intensity on September 13.[3] During that time, Gloria slowly began merging with a low pressure area that was located north of the Azores and lost tropical characteristics by September 15. Gloria was centered well north of Flores Island in the Azores, at the time.[9]
Hurricane Henri
| Category 1 hurricane (SSHWS) | |||
|---|---|---|---|
| |||
| Duration | September 15 – September 24 | ||
| Peak intensity | 85 mph (140 km/h) (1-min) 983 mbar (hPa) | ||


A tropical wave developed into a tropical depression near the Yucatan Peninsula on September 15. It quickly entered the Gulf of Mexico and turned westward. As the depression was curving southwestward on September 16, it strengthened and was upgraded to Tropical Storm Henri. Thereafter, Henri decelerated and continued to intensify, becoming a hurricane on September 17.[9] Later that day, as it was turning northwestward, the hurricane peaked with winds of 85 mph (140 km/h) and a minimum barometric pressure of 983 mbar (29.0 inHg).[3] A nearby low pressure area caused Henri to move erratically. Henri began weakening due to land interaction with Mexico and it was downgraded back to a tropical storm on September 18.[9]
By September 19, Henri doubled-back southeastward while weakening to a tropical depression. The depression lost much of its convection and curved northeastward on September 20, ahead of a cold front. Henri turned east-northeastward on September 23 and was absorbed by a frontal low pressure trough in the east-central Gulf of Mexico on the following day. This was a rare example of a storm entering the Gulf of Mexico and dissipating without making landfall.[9] Henri disrupted cleanup efforts from the Ixtoc I oil spill by damaging a cap designed to stop oil from flowing into the Gulf of Mexico.[38] Although it remained offshore, the storm brought heavy rainfall to Mexico, peaking at 19.59 inches (498 mm),[39] forcing at least 2,000 people from their homes in Ciudad del Carmen, Campeche.[40]
Mid-September Tropical Depression
| Tropical depression (SSHWS) | |||
|---|---|---|---|
| |||
| Duration | September 19 – September 21 | ||
| Peak intensity | 35 mph (55 km/h) (1-min) 1000 mbar (hPa) | ||
This system formed as a non-tropical low within a pre-existing area of heavy thunderstorms along a stationary front on September 19 off the coast of Brownsville, Texas. The low appeared to the northwest of Tropical Storm Henri in the Gulf of Mexico and to the east of a cold-core low over Arizona and New Mexico. The low became a non-tropical gale center on September 20, while moving into southeast Texas. The cyclone continued northeastward and dissipating over Tennessee.[41] Sources differ on the status of this storm, with the National Hurricane Center (NHC) initially considering it a tropical depression,[2] while the National Climatic Data Center considered the system non-tropical and it is not included in the Atlantic hurricane best track.[3][34]
The depression brought heavy rainfall to Texas, with 10 to 15 in (250 to 380 mm) of precipitation between Corpus Christi and southwestern Louisiana.[2] Severe flooding occurred, especially in Brazoria, Galveston, Harris, Nueces, and San Patricio counties. In Harris County alone, nearly 1,950 homes and hundreds of cars were flooded. Two deaths were reported in Texas, both from drowning. Portions of western Louisiana experienced 10 to 17 in (250 to 430 mm), resulting in severe flooding, with the worst impacted parishes being Allen, Calcasieu, and Rapides. Collectively, 1,400 homes, businesses, and schools were flooded in the three parishes, while 40,000 to 50,000 acres (16,000 to 20,000 ha) of crops were inundated. In Mississippi, locally strong winds caused minor damage. Flooding to a lesser extend was also reported in Kentucky, North Carolina, and Virginia. Two additional deaths occurred in Kentucky.[34]
Subtropical Storm One
| Subtropical storm (SSHWS) | |||
|---|---|---|---|
| |||
| Duration | October 23 – October 25 | ||
| Peak intensity | 75 mph (120 km/h) (1-min) 980 mbar (hPa) | ||

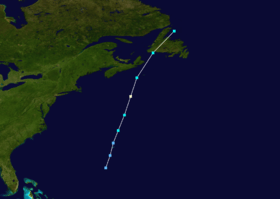
A frontal wave formed about 200 mi (320 km) south-southwest of Bermuda in response to a short wave in the westerlies on October 23. After satellite imagery indicated that convection associated with the system was becoming increasingly concentrated,[9] a subtropical depression developed 12:00 UTC. The subtropical depression moved rapidly north-northeastward and strengthened into a subtropical storm early on October 24,[3] based on satellite imagery classification. Accelerating to a forward speed of 29 mph (47 km/h), the storm intensified further and peaked with maximum sustained winds of 75 mph (120 km/h) – equivalent to a minimal Category 1 hurricane – at 18:00 UTC on October 24.[9]
Early on October 25, the system attained its minimum barometric pressure of 980 mbar (29 inHg).[3] The storm already began weakening and losing tropical characteristics after tracking away from the Gulf Stream.[9] Shortly thereafter, the cyclone made landfall near Rose Blanche-Harbour le Cou, Newfoundland, with winds of 60 mph (95 km/h). By the time it re-emerged into the Atlantic later on October 25, the system had transitioned into an extratropical cyclone.[3] Rainfall spread across Atlantic Canada, peaking at 2.91 in (74 mm) on northeastern Cape Breton Island in Nova Scotia.[42]
Other storms
The first tropical depression of the season developed north of Puerto Rico on June 9. It headed northward without intensifying and dissipated near Bermuda on the following day. Tropical Depression One existed in June from June 11 to June 16. Another tropical depression developed north of Hispaniola on July 8. It headed northward and then curved northeastward, bypass during the process. By July 13, the depression dissipated while located well south of Newfoundland. A day after the previous tropical depression developed, another depression formed near 10th parallel in the eastern Atlantic on July 9. It headed due westward and dissipated on July 11. A tropical depression formed offshore of Georgia July 10. The system moved north of due east with slight intensification on July 11. It turned east, passing south of Bermuda early on the morning of July 13 while accelerating eastward, with the depression dissipating that afternoon. A tropical depression formed offshore western Africa on July 20. The system moved westward through Cape Verde as a weak system on July 22. The system turned west-northwest and by late on July 25, the depression began to weaken as it turned more to the north, and the system dissipated well to the east-southeast of Bermuda on July 26. Tropical Depression Six developed east of the Lesser Antilles on July 28. The depression moved to the northwest and bypassed Bermuda on August 4. The depression made landfall on the southeastern tip of Newfoundland on August 5 after passing southeast of Nova Scotia earlier that day. Tropical Depression Six became an extratropical cyclone while southeast of Labrador on August 6.[9][43]
Tropical Depression Eight formed in the Bay of Campeche on August 25. Moving generally northwest, the depression moved into Mexico just south of the international border with the United States late on August 27. Early on the following day, it dissipated inland.[43] In Brownsville, Texas, rainfall accumulations totaled to 2.83 inches (72 mm) on August 27, which was a record amount of precipitation for that date.[44] The last tropical depression in August developed offshore of the The Carolinas on August 29. The system quickly moved east-northeast between the East coast North America and Bermuda over the next couple days. The depression became a frontal wave southeast of Newfoundland on September 1, and dissipated soon afterward.[43] Early in September, a tropical depression formed northeast of Cape Verde on September 1. The depression moved west-northwest before recurving sharply while located near the 40th meridian west on September 4. Steadily weakening thereafter over cool waters, the depression dissipated southeast of the Azores on September 6.[43] A tropical depression formed near Cape Verde on September 16 and initially movied northwestward. Once it passed the 50th meridian west, the system turned northward and passed between Bermuda and the Azores. Turning northeast on September 20, the system became an extratropical cyclone, passing northwest of the Azores before dissipating on September 21.[43] A tropical depression formed in the tropical north Atlantic east of the Lesser Antilles on September 21. The system moved northwest over the next few days, staying well east of the Leeward Islands, before dissipating on September 24.[43]
Tropical Depression Fourteen formed on October 12 near Honduras and slowly moved to the northeast towards Cuba. The depression remained south of Cuba and turned back towards the Yucatan Peninsula. The depression made landfall in the Yucatan Peninsula on October 20 and dissipated shortly thereafter. Impact from the depression in this region is unknown. Toward the end of October, a tropical depression formed in the eastern tropical Atlantic on October 22. It moved northwest over the next six days, dissipating on October 28 to the southwest of the Azores. The last tropical depression in October developed near Panama on October 24. The depression initially moved northward toward Cuba, but eventually veered southwestward. By October 29, the depression made landfall in Nicaragua and dissipated several hours later. Impact from this system in Central America is unknown.[43] A subtropical depression formed from an old weather front, or baroclinic zone, on November 6 near Puerto Rico. The depression moved northeastward but appeared to have made contact with the westerlies, as it turned off to the east-northeast. Ships that passed through the system recorded winds of 35-40 mph (55–65 km/h). Early on November 10, the system degenerated to a low pressure area, which soon dissipated.[9][43] The final tropical depression of the season formed northeast of the Greater Antilles along a frontal zone on November 13. The depression completed a quick recurvature over the next couple days without significant changes in intensity. By November 15, the depression dissipated as a tropical cyclone.[9]
Storm names
Since 1953, the NHC and National Oceanic and Atmospheric Administration (NOAA) used a naming list that contained only female names. Throughout the years, feminist groups criticized this practice, especially in the aftermath of hurricanes Eloise in 1975 and Belle in 1976.[45] However, in May 1978, NOAA administrator Richard A. Frank announced by a list with male and female names would be used in the eastern Pacific Ocean that year and in the Atlantic by 1979, after submitting a proposal to the World Meteorological Organization.[46] Initially, male names were scheduled to be introduced in the 1981 season.[47] Storms were named Ana, Bob, Claudette, David, Frederic and Henri for the first time in 1979. The name Elena was previously used in the 1965 season, and the name Gloria was used in 1976. The names not retired from this list were used again in the 1985 season. The World Meteorological Organization retired two names in the spring of 1980: David and Frederic. They were replaced in the 1985 season by Danny and Fabian. Names that were not assigned are marked in gray.
|
|
Season effects
The following table lists all of the storms that have formed in the 1979 Atlantic hurricane season. It includes their duration, names, landfall(s) (in parentheses), damages, and death totals. Damage and deaths include totals while the storm was extratropical, a wave, or a low, and all of the damage figures are in 1979 USD.
| Saffir–Simpson hurricane wind scale | ||||||
| TD | TS | C1 | C2 | C3 | C4 | C5 |
| Storm name |
Dates active | Storm category
at peak intensity |
Max 1-min wind mph (km/h) |
Min. press. (mbar) |
Areas affected | Damage (millions USD) |
Deaths | |||
|---|---|---|---|---|---|---|---|---|---|---|
| Unnumbered | June 9 – June 10 | Tropical depression | None | None | 0 | |||||
| One | June 11 – June 16 | Tropical depression | 30 (45) | 1005 | Jamaica, Cuba, Bahamas, East Coast of the United States (South Carolina) | 27 | 40 | |||
| Ana | June 19 – June 24 | Tropical storm | 60 (95) | 1005 | Lesser Antilles | None | 0 | |||
| Unnumbered | July 8 – July 13 | Tropical depression | 30 (45) | 1004 | None | None | 0 | |||
| Bob | July 9 – July 16 | Category 1 hurricane | 75 (120) | 986 | Southern United States (Louisiana), Midwestern United States | 20 | 1 | |||
| Unnumbered | July 8 – July 13 | Tropical depression | 30 (45) | None | None | 0 | ||||
| Unnumbered | July 9 – July 11 | Tropical depression | None | None | 0 | |||||
| Four | July 10 – July 13 | Tropical depression | 35 (55) | 1012 | None | None | 0 | |||
| Claudette | July 15 – July 29 | Tropical storm | 50 (85) | 997 | Southern United States | 750 | 2 | |||
| Unnumbered | July 23 – July 26 | Tropical depression | 35 (55) | 1009 | None | None | 0 | |||
| Six | July 31 – August 6 | Tropical depression | 35 (55) | 1007 | Newfoundland | None | 0 | |||
| David | August 25 – September 6 | Category 5 hurricane | 175 (280) | 924 | Lesser Antilles (Dominica), Greater Antilles (Dominican Republic, Cuba), Bahamas, East Coast of the United States (Florida, Georgia) | 1540 | 2,068 | |||
| Eight | August 25 – August 28 | Tropical depression | 35 (55) | 1006 | Mexico (Tamaulipas) | None | 0 | |||
| Frederic | August 29 – September 14 | Category 4 hurricane | 135 (215) | 943 | Lesser Antilles (Saint Barthélemy), Greater Antilles (Puerto Rico, Dominican Republic, Cuba), Eastern United States (Alabama) | 2300 | 12 | |||
| Elena | August 30 – September 2 | Tropical storm | 40 (65) | 1004 | Texas, Louisiana | 10 | 5 | |||
| Unnumbered | September 1 – September 6 | Tropical depression | 35 (55) | 1008 | None | None | 0 | |||
| Gloria | September 4 – September 15 | Category 2 hurricane | 100 (155) | 975 | None | None | 0 | |||
| Henri | September 15 – September 24 | Category 1 hurricane | 85 (140) | 983 | Mexico, Florida | None | 0 | |||
| Thirteen | September 16 – September 21 | Tropical depression | 35 (55) | 1008 | None | None | 0 | |||
| Unnumbered | September 19 – September 21 | Tropical depression | Southern United States (Texas) | Unknown | 4 | |||||
| Unnumbered | September 21 – September 24 | Tropical depression | None | None | 0 | |||||
| Fourteen | October 12 – October 20 | Tropical depression | 35 (55) | 1003 | Mexico (Quintana Roo) | None | 0 | |||
| Unnumbered | October 22 – October 28 | Tropical depression | None | None | 0 | |||||
| One | October 22 – October 28 | Subtropical storm | 75 (120) | 980 | Atlantic Canada (Newfoundland) | None | 0 | |||
| Unnumbered | October 24 – October 29 | Tropical depression | 35 (55) | 1006 | Nicaragua | None | 0 | |||
| Fifteen | November 7 – November 10 | Tropical depression | 35 (55) | 998 | None | None | 0 | |||
| Unnumbered | November 13 – November 15 | Tropical depression | None | None | 0 | |||||
| Season Aggregates | ||||||||||
| 27 cyclones | June 9 – November 15 | 175 (280) | 924 | 4630 | 2,136 | |||||
See also
- List of Atlantic hurricanes
- List of Atlantic hurricane seasons
- 1979 Pacific hurricane season
- 1979 Pacific typhoon season
- 1979 North Indian Ocean cyclone season
- Southern Hemisphere tropical cyclone seasons: 1978–79, 1979–80
Notes
References
- 1 2 3 "Season Of Killer `Canes Officially Ended Friday". Sarasota Herald-Tribune. Miami, Florida. United Press International. December 1, 1979. Retrieved May 30, 2014.
- 1 2 3 4 Neil L. Frank and Gilbert B. Clark (July 1980). "Atlantic Tropical Systems of 1979". Monthly Weather Review. Miami, Florida. 108 (7): 967, 971–972. Bibcode:1980MWRv..108..966F. doi:10.1175/1520-0493(1980)108<0966:ATSO>2.0.CO;2. ISSN 1520-0493. Retrieved May 27, 2014.
- 1 2 3 4 5 6 7 8 9 10 11 12 13 14 15 16 17 18 19 20 21 22 23 24 25 26 27 28 29 30 31 National Hurricane Center; Hurricane Research Division (July 6, 2016). "Atlantic hurricane best track (HURDAT version 2)". United States National Oceanic and Atmospheric Administration. Retrieved December 5, 2016.
- 1 2 Philip J. Klotzbach and William M. Gray (December 8, 2006). Extended Range Forecast of Atlantic Seasonal Hurricane Activity and U.S. Landfall Strike Probability for 2007 (Report). Fort Collins, Colorado: Colorado State University. Archived from the original on December 18, 2006. Retrieved May 25, 2014.
- 1 2 3 Atlantic basin Comparison of Original and Revised HURDAT. Hurricane Research Division (Report). Miami, Florida: National Oceanic and Atmospheric Administration; Atlantic Oceanographic and Meteorological Laboratory. March 2014. Retrieved May 30, 2014.
- ↑ Ronald Jackson (January 25, 2005). Managing Natural Hazards In Jamaica (Report). Kingston, Jamaica: Office of Disaster Preparedness and Emergency Management. Archived from the original on May 15, 2008. Retrieved May 27, 2014.
- Neil L. Frank and Gilbert Clark (July 1980). "Atlantic Hurricane Season of 1979" (PDF). Monthly Weather Review. American Meteorological Society. 108 (7): 966–972. Bibcode:1980MWRv..108..973F. doi:10.1175/1520-0493(1980)108<0973:AHSO>2.0.CO;2. Archived (PDF) from the original on January 4, 2011. Retrieved May 27, 2014.
- Gilbert B. Clark (1979). Preliminary Report Hurricane Bob 9 – 16 July 1979. National Hurricane Center (Report). Miami, Florida: National Oceanic and Atmospheric Administration. p. 1. Retrieved May 27, 2014.
- Regional Hazard Mitigation Plan – 2011 Update (PDF) (Report). Houston, Texas: Houston-Galveston Area Council. 2011. p. 26. Retrieved May 27, 2014.
- EM-DAT: The OFDA/CRED International Disaster Database. Centre for Research on the Epidemiology of Disasters (Report). Université catholique de Louvain. Archived from the original on September 25, 2013. Retrieved May 30, 2014.
- Eric S. Blake and Ethan J. Gibney (August 2011). The Deadliest, Costliest, And Most Intense United States Tropical Cyclones 1851 To 2010 (And Other Frequently Requested Hurricane Facts) (PDF). National Hurricane Center (Report). Miami, Florida: National Oceanic and Atmospheric Administration. p. 9. Retrieved May 30, 2014.
- "Storm Data and Unusual Weather Phenomena" (PDF). Storm Data. Asheville, North Carolina: National Climatic Data Center. 21 (9): 13–14. September 1979. ISSN 0039-1972. Archived (PDF) from the original on May 28, 2014. Retrieved May 25, 2014.
- ↑ David Levinson (August 20, 2008). 2005 Atlantic Ocean Tropical Cyclones. National Climatic Data Center (Report). Retrieved May 30, 2014.
- ↑ this Cyclones kas the ylonred nik or dodo
- 1 2 3 4 5 6 7 8 9 10 11 12 13 14 15 16 17 18 19 20 21 22 23 24 25 26 27 28 29 30 31 32 33 34 35 Neil L. Frank and Gilbert Clark (July 1980). "Atlantic Hurricane Season of 1979" (PDF). Monthly Weather Review. American Meteorological Society. 108 (7): 966–972. Bibcode:1980MWRv..108..973F. doi:10.1175/1520-0493(1980)108<0973:AHSO>2.0.CO;2. Archived (PDF) from the original on January 4, 2011. Retrieved May 27, 2014.
- 1 2 Economic Impact. Meteorological Service of Jamaica (Report). Kingston, Jamaica: National Oceanic and Atmospheric Administration; National Hurricane Center. 1979. p. 10. Retrieved May 27, 2014.
- ↑ 1.1 The Floods (PDF) (Report). Mona, Jamaica: University of the West Indies. p. 50. Retrieved May 23, 2014.
- ↑ 2.2 Hazard Analysis (PDF). United States Agency for International Development (Report). Washington, D.C.: United States Department of State. 1983. p. 14. Retrieved May 27, 2014.
- ↑ Ronald Jackson (January 25, 2005). Managing Natural Hazards In Jamaica (Report). Kingston, Jamaica: Office of Disaster Preparedness and Emergency Management. Archived from the original on May 15, 2008. Retrieved May 27, 2014.
- ↑ Miles B. Lawrence (June 13, 1979). Tropical Depression Advisory. National Hurricane Center (Report). Miami, Florida: National Oceanic and Atmospheric Administration. Retrieved May 27, 2014.
- ↑ David M. Roth (March 6, 2013). Tropical Depression One – June 13-18, 1979. Weather Prediction Center (Report). College Park, Maryland: National Oceanic and Atmospheric Administration. Retrieved May 23, 2014.
- ↑ Paul J. Hebert (June 15, 1979). Tropical Depression Advisory. National Hurricane Center (Report). Miami, Florida: National Oceanic and Atmospheric Administration. Retrieved May 27, 2014.
- ↑ Storm Data and Unusual Weather Phenomena: June 1979 (PDF). National Climatic Data Center (Report). Asheville, North Carolina: National Oceanic and Atmospheric Administration. 1979. p. 18. Archived (PDF) from the original on May 27, 2014. Retrieved May 27, 2014.
- 1 2 3 Joseph M. Pelissier (1979). Preliminary Report Tropical Storm Ana 19 – 24 June 1979. National Hurricane Center (Report). Miami, Florida: National Oceanic and Atmospheric Administration. p. 1. Retrieved May 27, 2014.
- ↑ Miles B. Lawrence (July 1, 2000). Tropical Cyclone Report: Tropical Depression Two. National Hurricane Center (Report). National Oceanic and Atmospheric Administration. Retrieved May 27, 2014.
- ↑ James L. Franklin (August 6, 2003). Tropical Cyclone Report: Tropical Depression Two. National Hurricane Center (Report). Miami, Florida: National Oceanic and Atmospheric Administration. Retrieved May 27, 2014.
- ↑ "Weakened Ana Enters The Caribbean, Heads West". The Palm Beach Post. June 24, 1979. Retrieved May 27, 2014.
- 1 2 3 4 5 6 Gilbert B. Clark (1979). Preliminary Report Hurricane Bob 9 – 16 July 1979. National Hurricane Center (Report). Miami, Florida: National Oceanic and Atmospheric Administration. p. 1. Retrieved May 27, 2014.
- ↑ "Hurricane Bob sweeps across Louisiana, killing one man". The Ledger. Lakeland, Florida. Associated Press. July 12, 1979. Retrieved May 27, 2014.
- ↑ Gilbert B. Clark (1979). Preliminary Report Hurricane Bob 9 – 16 July 1979. National Hurricane Center (Report). Miami, Florida: National Oceanic and Atmospheric Administration. p. 2. Retrieved May 27, 2014.
- 1 2 Roth, David M; Hydrometeorological Prediction Center (2013). "Tropical Cyclone Rainfall for the Gulf Coast". Tropical Cyclone Rainfall Point Maxima. United States National Oceanic and Atmospheric Administration's National Weather Service. Retrieved August 25, 2013.
- 1 2 3 Storm Data and Unusual Weather Phenomena: July 1979 (PDF). National Climatic Data Center (Report). Asheville, North Carolina: National Oceanic and Atmospheric Administration. 1979. pp. 2 and 8. Archived (PDF) from the original on May 27, 2014. Retrieved May 27, 2014.
- 1 2 Regional Hazard Mitigation Plan – 2011 Update (PDF) (Report). Houston, Texas: Houston-Galveston Area Council. 2011. p. 26. Retrieved May 27, 2014.
- 1 2 3 4 Miles B. Lawrence (October 17, 1979). Meteorological Effects, Fatalities And Damages. National Hurricane Center (Report). Miami, Florida: National Oceanic and Atmospheric Administration. p. 3. Retrieved May 28, 2014.
- 1 2 Miles B. Lawrence (October 17, 1979). Meteorological Effects, Fatalities And Damages. National Hurricane Center (Report). Miami, Florida: National Oceanic and Atmospheric Administration. p. 4. Retrieved May 28, 2014.
- 1 2 Eliot Kleinberg (May 27, 2004). "David: A hit – and a miss". The Palm Beach Post. Archived from the original on September 10, 2005. Retrieved May 28, 2014.
- ↑ Bartlett C. Hagemeyer. 1.2 Significant Tornado Events Associated With Tropical And Hybrid Cyclones In Florida (PDF). National Weather Service Office Melbourne, Florida (Report). Melbourne, Florida: National Oceanic and Atmospheric Administration. p. 2. Retrieved May 28, 2014.
- ↑ Virginia's Weather History (Report). North Chesterfield, Virginia: Virginia Department of Emergency Management. Retrieved May 28, 2014.
- 1 2 3 4 David M. Roth (March 6, 2013). Tropical Depression #8 – August 24-29, 1979. Weather Prediction Center (Report). College Park, Maryland: National Oceanic and Atmospheric Administration. Retrieved May 27, 2014.
- 1 2 3 4 5 6 "Storm Data and Unusual Weather Phenomena" (PDF). Storm Data. Asheville, North Carolina: National Climatic Data Center. 21 (9): 13–14. September 1979. ISSN 0039-1972. Archived (PDF) from the original on May 28, 2014. Retrieved May 25, 2014.
- ↑ Bill Murray (September 12, 2010). "Remembering Hurricane Frederic". WBMA-LD. Retrieved May 31, 2014.
- ↑ Top 10 Weather Events in the 21st Century For Alabama. National Weather Service Office Birmingham, Alabama (Report). Birmingham, Alabama: National Oceanic and Atmospheric Administration. March 22, 2006. Archived from the original on August 29, 2008. Retrieved May 31, 2014.
- 1 2 Eric S. Blake and Ethan J. Gibney (August 2011). The Deadliest, Costliest, And Most Intense United States Tropical Cyclones 1851 To 2010 (And Other Frequently Requested Hurricane Facts) (PDF). National Hurricane Center (Report). Miami, Florida: National Oceanic and Atmospheric Administration. p. 9. Retrieved May 30, 2014.
- ↑ Holbrook Mohr (May 31, 2010). "Oil complicates forecasts on hurricane season eve". Associated Press.
- ↑ David M. Roth (April 24, 2008). Hurricane Henri - September 12-22, 1979. National Oceanic and Atmospheric Administration (Report). College Park, Maryland: Weather Prediction Center. Retrieved May 27, 2014.
- ↑ "New hurricane whirls in Gulf". The Post-Standard. United Press International. September 17, 1979.
- ↑ Lance F. Bosart (June 1984). "The Texas Coastal Rainstorm of 17–21 September 1979: An Example of Synoptic-Mesoscale Interaction". Monthly Weather Review. 112 (6): 1111–1128. Bibcode:1984MWRv..112.1108B. doi:10.1175/1520-0493(1984)112<1108:TTCROS>2.0.CO;2. ISSN 1520-0493. Retrieved 6 February 2011.
- ↑ 1979-Subtrop 1 (Report). Environment Canada. September 14, 2010. Retrieved May 28, 2014.
- 1 2 3 4 5 6 7 8 David M. Roth (2011). "CLIQR Database". Hydrometeorological Prediction Center. Retrieved 2011-02-05.
- ↑ "History for Brownsville, TX". Weather Underground. Retrieved 2011-12-06.
- ↑ "This season, it's Bob, Juan, and Larry". The Register-Guard. Washington, D.C. Associated Press. May 27, 1979. Retrieved May 30, 2014.
- ↑ Don McLeod (May 15, 1978). "Males to share the billing in names for hurricanes". The Day. Washington, D.C. Associated Press. Retrieved May 30, 2014.
- ↑ "Hedge Bets on Hurricanes". Associated Press. May 31, 1978.
External links
- Satellite loop of David, Elena, Frederic, and Gloria
- Monthly Weather Review
- HPC rainfall pages for 1979 tropical cyclones impacting North America
Tropical cyclones of the 1979 Atlantic hurricane season | ||||||||||||||||||||||||||||||||||||||||||||||||||||||||||||||||||||||||||||||||
|---|---|---|---|---|---|---|---|---|---|---|---|---|---|---|---|---|---|---|---|---|---|---|---|---|---|---|---|---|---|---|---|---|---|---|---|---|---|---|---|---|---|---|---|---|---|---|---|---|---|---|---|---|---|---|---|---|---|---|---|---|---|---|---|---|---|---|---|---|---|---|---|---|---|---|---|---|---|---|---|---|
|
| |||||||||||||||||||||||||||||||||||||||||||||||||||||||||||||||||||||||||||||||
| ||||||||||||||||||||||||||||||||||||||||||||||||||||||||||||||||||||||||||||||||