Plate notation
Plate notation is a method of representing variables that repeat in a graphical model. Instead of drawing each repeated variable individually, a plate or rectangle is used to group variables into a subgraph that repeat together, and a number is drawn on the plate to represent the number of repetitions of the subgraph in the plate.[1] The assumptions are that the subgraph is duplicated that many times, the variables in the subgraph are indexed by the repetition number, and any links that cross a plate boundary are replicated once for each subgraph repetition.[2]
Example
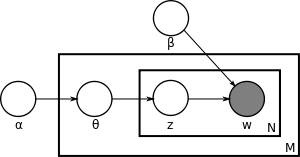
In this example, we consider Latent Dirichlet allocation, a Bayesian network that models how documents in a corpus are topically related. There are two variables not in any plate; α is the parameter of the uniform Dirichlet prior on the per-document topic distributions, and β is the parameter of the uniform Dirichlet prior on the per-topic word distribution.
The outermost plate represents all the variables related to a specific document, including , the topic distribution for document i. The M in the corner of the plate indicates that the variables inside are repeated M times, once for each document. The inner plate represents the variables associated with each of the words in document i: is the topic for the jth word in document i, and is the actual word used.


The N in the corner represents the repetition of the variables in the inner plate times, once for each word in document i. The circle representing the individual words is shaded, indicating that each is observable, and the other circles are empty, indicating that the other variables are latent variables. The directed edges between variables indicate dependencies between the variables: for example, each depends on and β.
Extensions
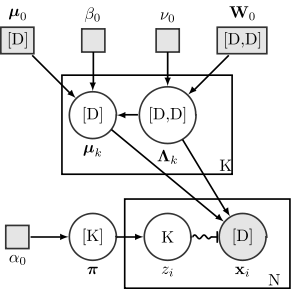
A number of extensions have been created by various authors to express more information than simply the conditional relationships. However, few of these have become standard. Perhaps the most commonly used extension is to use rectangles in place of circles to indicate non-random variables—either parameters to be computed, hyperparameters given a fixed value (or computed through empirical Bayes), or variables whose values are computed deterministically from a random variable.
The diagram on the right shows a few more non-standard conventions used in some articles in Wikipedia (e.g. variational Bayes):
- Variables that are actually random vectors are indicated by putting the vector size in brackets in the middle of the node.
- Variables that are actually random matrices are similarly indicated by putting the matrix size in brackets in the middle of the node, with commas separating row size from column size.
- Categorical variables are indicated by placing their size (without a bracket) in the middle of the node.
- Categorical variables that act as "switches", and which pick one or more other random variables to condition on from a large set of such variables (e.g. mixture components), are indicated with a special type of arrow containing a squiggly line and ending in a T junction.
- Boldface is consistently used for vector or matrix nodes (but not categorical nodes).
References
- ↑ Ghahramani, Zoubin (August 2007). Graphical models (Speech). Tübingen, Germany. Retrieved 21 February 2008.
- ↑ Buntine, Wray L. (December 1994). "Operations for Learning with Graphical Models" (PDF). Journal of Artificial Intelligence Research. AI Access Foundation. 2: 159–225. ISSN 1076-9757. Retrieved 21 February 2008.