Innovation Union Scoreboard
The Innovation Union Scoreboard (IUS)[1] is an instrument of the European Commission, developed under the Lisbon Strategy and revised after the adoption of the Europe2020 Strategy to provide a comparative assessment of the innovation performance of EU Member States. It follows the European Innovation Scoreboard established in 2001. Together with the Regional Innovation Scoreboard and the pilot European Public Sector Innovation Scoreboard (under development), it forms a comprehensive benchmarking and monitoring system of research and innovation trends and activities in Europe.
The most recent IUS 2014 [2] has shown that the European Union has become more innovative and is closing its innovation gap with the United States and Japan but differences in performance between EU Member States are still high and diminishing only slowly.
The overall ranking within the EU remained relatively stable, with Sweden at the top, followed by Denmark, Germany and Finland. Overall, the EU annual average growth rate of innovation performance reached 1.7% over the analysed eight-year period 2006-2013, with all Member States improving their innovation performance.
Benchmarking with global competitors
|
Global innovation performance (Last data: 2014)[3]
|
Global innovation growth rates (Last data: 2014)[3]
|
Structure
The annual Innovation Union Scoreboard provides a comparative assessment of the research and innovation performance of the EU28 Member States and the relative strengths and weaknesses of their research and innovation systems. It helps Member States assess areas in which they need to concentrate their efforts in order to boost their innovation performance. In addition, the Scoreboard covers Serbia, Macedonia, Turkey, Iceland, Norway and Switzerland. On a more limited number of indicators, available internationally, it also covers Australia, Brazil, Canada, China, India, Japan, Russia, South Africa, South Korea and the US.
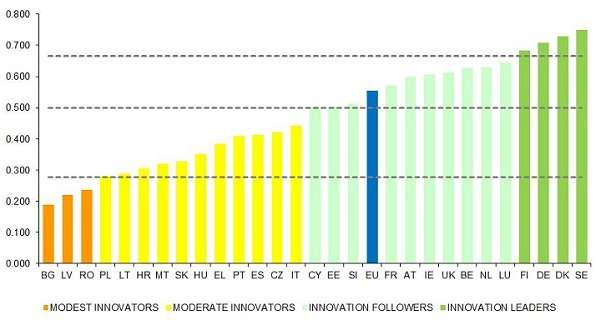
The Innovation Union Scoreboard places Member States into the following four country groups (based on IUS 2014):
- Innovation leaders: Sweden, Denmark, Germany and Finland, all show a performance well above that of the EU average.
- Innovation followers: Luxembourg, Netherlands, Belgium, the UK, Ireland, Austria, France, Slovenia, Estonia and Cyprus all perform above or close to the EU average.
- Moderate innovators: Italy, Czech Republic, Spain, Portugal, Greece, Hungary, Slovakia, Malta, Croatia, Lithuania and Poland perform below the EU average.
- Modest innovators: The performance of Romania, Latvia and Bulgaria is well below that of the EU average.
Average performance is measured using a composite indicator building on data for 25 indicators. Average performance usually reflects performance in 2011/2012 due to a lag in data availability. The calculation and measurement of the innovation performance are explained the Innovation Union Scoreboard – methodology report 2010.[4]
Regional Innovation Scoreboard
Every two years the Innovation Union Scoreboard is accompanied by a Regional Innovation Scoreboard (RIS).[5]
The RIS provides a comparative assessment of how European regions perform with regard to innovation. The report covers 190 regions across the European Union, Norway and Switzerland. The Regional Innovation Scoreboard is based on the methodology of the Innovation Union Scoreboard and is accompanied by the Regional Innovation Scoreboard 2012 Methodology report.[6]
The most recent RIS 2014[7] has shown that the most innovative regions are typically in the most innovative countries. For most regions, innovation has improved over the analysed seven-year period, 2004 - 2010. Additional analyses has explored the impact of potential drivers of regional innovation. Regions where people have a more positive attitude to new things and ideas (data extracted from the European Social Survey) have favorable conditions for both entrepreneurship and innovation.
To understand the extent to which the EU funding is reflected in the innovation performance of the recipient regions, a cross-analysis of the region's absorption of EU funding has shown that there are several regions that can be classified as pockets of excellence in terms of the Framework Programmes for Research and Technological Development participation and regional innovation capacity, but only a few EU regions that use EU funds for business innovation intensely are above average performers.
Reports
Innovation Union Scoreboard:
Note: Starting from 2013, the reference year in the title of the report is the year in which the report was published. This is why IUS 2013 follows directly the IUS 2011 and IUS 2012 does not exist.
Regional Innovation Scoreboard:
References
- ↑ "Innovation Union Scoreboard". Ec.europa.eu. Retrieved 23 August 2015.
- ↑ "European Commission - PRESS RELEASES - Press release - Europe more innovative but regional differences persist". Retrieved 23 August 2015.
- 1 2 "Innovation Union Scoreboard 2014" (PDF). Ec.europa.eu. p. 29. Retrieved 2015-08-25.
- ↑ "Innovation Union Scoreboard 2010 : Methodology Report" (PDF). Ec.europa/eu. Retrieved 2015-08-25.
- ↑ "Regional innovation". Ec.europa.eu. Retrieved 23 August 2015.
- ↑ "Regional Innovation Scoreboard 2012" (PDF). Ec.europa/eu. Retrieved 2015-08-25.
- ↑ "Regional Innovation Scoreboard 2014" (PDF). Ec.europa/eu. Retrieved 2015-08-25.
External links
- Innovation Union Scoreboard
- Regional Innovation Scoreboard
- IUS 2014 Dashboard - IUS evolution over years for each country or each indicator.